FnCharts Professional 8.0 - User's Guide
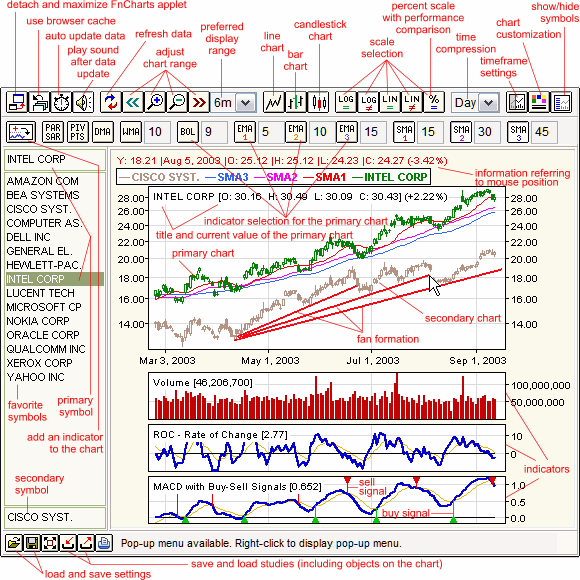
Screenshot along with descriptions
Quick tour
- Displaying charts
To display a given chart select a symbol from the list of favorite symbols (on the left) or enter a symbol into primary symbol field just above the list. The symbol can be a ticker, stock name, currency or index (the actual naming convention depends on the website owner). If you want to compare the chart to other symbol, enter a symbol name into secondary symbol field, below the symbol list. You can also compare performance of multiple stocks by first selecting the percent (performance) scale and then selecting multiple symbols. Please note, that when you enter a new symbol, it is automatically added to the list of favorite symbols for your convenience. You can set the desired display range for charts by selecting a preferred display range option in the top toolbar. Please note, that preferred range also depends on the actual amount of data available and actual timeframe settings (see also paragraph 5). - Working with indicators
To add and display technical indicators click the 'Add indicator' button available in the second toolbar, or select one of the other buttons in the second toolbar. Indicator parameters can be adjusted using text fields to the right of an indicator. Enter desired parameter value and press the [ENTER] key to apply the new parameter. If multiple symbols are displayed at the same time, then the indicators are calculated for the primary symbol. - Chart customization
Using the options available in the first toolbar, you can set a chart type, a scale, data compression or adjust the amount of data displayed. To customize line widths and colors press the "chart customization" button (located on the right side of the first toolbar). - Working with trendlines, formations and other objects
You can draw various objects on the chart using the mouse. First, select an object in the pop-up menu of the chart, and then press the left mouse button and drag the mouse to draw an object. To move an object, hold the [SHIFT] key (in automatic drawing mode), to delete an object hold the [CTRL] key (in automatic drawing mode). You can easily create trendlines parallel to an existing line. Just press and hold both [CTRL] and [SHIFT] and then drag the selected line to a new position. To put a text comment on the chart, first select the 'Text' option from the pop-up menu, then click on the chart and enter the text. To edit existing text comment, press and hold both [CTRL] and [SHIFT] and then click on a text. To change color of a given object press and hold both [CTRL] and [ALT] and then click the selected object and select new color. - Printing charts
To print a chart press the print button at the bottom of the program window. This option is not available with old Microsoft VM (Virtual Machine). You need to install newer version of Java(tm) to be able to print charts. Please note that the chart will be printed using currently selected chart colors (including the background color). - Optimizing program performance
Pressing the "timeframe settings" button will enable you to set the maximum amount of data processed by the program. Setting a shorter timeframe will increase the program performance. This can be important if you are using a slow computer or a low bandwidth Internet connection. - Storing and loading configuration settings
You can store and later load your preferred configuration settings, using the "load configuration" and "save configuration" buttons (in the status bar).
The following settings can be stored:
- favorite symbols along with current selection of primary and secondary symbol
- cache usage and automatic data update settings
- selected indicators
- defined indicators
- indicator parameters
- chart type, scale and data compression
- chart colors and line widths
In addition to the settings listed above, individual studies (including indicators, their parameters and objects on the chart) can be saved and later restored for a given security using the buttons on the bottom of the program window.
The option to load studies automatically is also available. When this option is switched on:You can save many sets of studies for every stock - one set of studies for every available time compression option.
- the program will remove all existing trendlines, formations and other objects from the chart every time you change the time compression option
- the program will try to load studies automatically every time you select a stock or change the time compression option
The list of available built-in indicators
- Acceleration (ACC)
- Accumulation Distribution (AD)
- Average True Range (ATR)
- Balance Of Power (BOP)
- Bollinger Band (BOL)
- Bollinger Oscillator (BOS)
- Chaikin A/D Oscillator (ChAD)
- Chaikin Money Flow (ChMF)
- Chaikin Oscillator (ChO)
- Chaikin Volatility (ChV)
- Chande Momentum Oscillator (CMO)
- Commodity Channel Index (CCI)
- Detrended Price Oscillator (DPO)
- Directional Movement Index (DMI)
- Displaced Moving Average (DMA)
- Ease of Movement (EMV)
- Elder-ray Bear Power (EBear)
- Elder-ray Bull Power (EBull)
- Exponential Moving Average (EMA)
- %D Fast (FastD)
- %D Slow (SlowD)
- %K Fast (FastK)
- Force Index (FI)
- Intraday Momentum Index (IMI)
- Mass Index (MI)
- Moving Average Convergence Divergence (MACD)
- MACD Oscillator (MACDO)
- Momentum - type 1 (MTM1)
- Momentum - type 2 (MTM2)
- Money Flow Index (MFI)
- Negative Volume Index (NVI)
- On Balance Volume (OBV)
- Parabolic SAR (PAR SAR)
- Pivot Points (PIV PTS)
- Positive Volume Index (PVI)
- Percentage Volume Oscillator (PVO)
- Price Oscillator (POS)
- Price and Volume Trend (PVT)
- QStick Indicator (QStick)
- Rate of Change (ROC)
- Relative Strength Index (RSI)
- Relative Volatility Index (RVI)
- Simple Moving Average (SMA1, SMA2, SMA3)
- Standard Deviation (StDev)
- Stochastic (STS)
- Trend Deviation (TRD)
- TRIX Index (Trix)
- Ultimate Oscillator (ULT)
- Volatility Ratio (VR)
- Volume Oscillator (VOS)
- Volume Rate of Change (VROC)
- Weighted Moving Average (WMA)
- Williams Accumulation Distribution (type 1) (WAD1)
- Williams Accumulation Distribution (type 2) (WAD2)
- Williams' %R (%R)
- Volume (with open interest if available) (VOL)
- Open Interest (OI)