| View previous topic :: View next topic |
| Author |
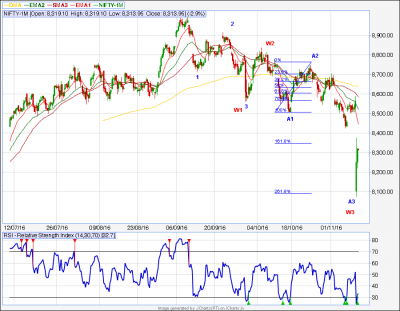
8113 tgt count |
amba123
White Belt

Joined: 05 Aug 2016
Posts: 4
|
Post: #1  Posted: Wed Nov 09, 2016 1:04 pm Post subject: 8113 tgt count Posted: Wed Nov 09, 2016 1:04 pm Post subject: 8113 tgt count |
 |
|
roughly shown my study
| Description: |
|
| Filesize: |
49.91 KB |
| Viewed: |
657 Time(s) |
|
|
|
| Back to top |
|
 |
|
| |
satishb
White Belt
Joined: 01 Mar 2009
Posts: 13
|
| Post: #2 Posted: Wed Nov 09, 2016 9:01 pm Post subject: |
|
|
What is the study Bro.
Sorry, Did not get it
|
|
| Back to top |
|
|
Niftyman
White Belt
Joined: 22 Mar 2015
Posts: 340
|
| Post: #3 Posted: Wed Nov 09, 2016 9:18 pm Post subject: |
|
|
Dear friend
This may be a good study. But doing postmortem on a chart and showing this and that, makes no sense.
If you are good in analysis, then you should have posted, where NIFTY or any other scrip (so to say) will move in short or very short time. Not mentioning for medium term (1-2 months) as no one remember, what was posted.
Good luck
|
|
| Back to top |
|
|
amba123
White Belt
Joined: 05 Aug 2016
Posts: 4
|
| Post: #4 Posted: Wed Nov 09, 2016 10:52 pm Post subject: |
|
|
| Niftyman wrote: | Dear friend
This may be a good study. But doing postmortem on a chart and showing this and that, makes no sense.
If you are good in analysis, then you should have posted, where NIFTY or any other scrip (so to say) will move in short or very short time. Not mentioning for medium term (1-2 months) as no one remember, what was posted.
Good luck |
niftyman: if you dont understand its not my problem...and im not giving adivse to buy or sell...this is my first post and trying to copy the link for the ppl who are intrested in my tgt study in shoout box...so i tried to post...and its not a postmortem.. the chart is and study is very clearly shown ....mostly you have not seen a better study till now i think....
|
|
| Back to top |
|
|
amba123
White Belt
Joined: 05 Aug 2016
Posts: 4
|
| Post: #5 Posted: Wed Nov 09, 2016 10:55 pm Post subject: |
|
|
| satishb wrote: | What is the study Bro.
Sorry, Did not get it |
mr satish...this is my trial post...next time ill try to explain along with the chart...thank you i have used fibb to mark the tgt ...and i use ew
|
|
| Back to top |
|
|
RAJDESAI1967
Yellow Belt

Joined: 19 Mar 2013
Posts: 518
|
| Post: #6 Posted: Thu Nov 10, 2016 12:29 pm Post subject: nifty |
|
|
Friend Amba..
As Niftyman rightly said... its a post moterm of what happend in past.
which noone cares much..
Hes not doubting on ur study..Whats required is based on ur views.
where the mkts are headed ..may be intra/weekly/ST...etc etc..
Would suggest,,, give ur views on your exp...where mkts will move...
|
|
| Back to top |
|
|
amitagg
Black Belt

Joined: 01 Oct 2013
Posts: 4559
|
| Post: #7 Posted: Thu Nov 10, 2016 10:43 pm Post subject: |
|
|
The start for a trader only happens this way and its a good exercise for beginners.
The future can be if it's WXY he is suggesting than this wave up to 8600 can be smaller X wave and it it extends to 8750-8800 still it can be bigger X wave and we need to breakdown the wave structure to determine which one and analuse little bit more and make some conclusions.....
We can be in sideways markets for 9100-7800 for many more months therefore .......( as per one prognosis) ( if you would want to call 1300 range !!!!!! Sideways!!!??? 
|
|
| Back to top |
|
|
|
|
You cannot post new topics in this forum
You cannot reply to topics in this forum
You cannot edit your posts in this forum
You cannot delete your posts in this forum
You cannot vote in polls in this forum
You can attach files in this forum
You can download files in this forum
|
Powered by phpBB © 2001, 2005 phpBB Group
|
|


