| View previous topic :: View next topic |
| Author |
9 x 20 cross over strategy |
anand512
White Belt

Joined: 26 Jun 2009
Posts: 109
|
Post: #1  Posted: Sat Aug 02, 2014 2:51 pm Post subject: 9 x 20 cross over strategy Posted: Sat Aug 02, 2014 2:51 pm Post subject: 9 x 20 cross over strategy |
 |
|
The 9/20 Cross
One of the strategies that I use to trade the market is based on the movement and location of the 9 EMA and the 20 MA on the daily and intra-day charts, which I refer to as the 9/20. It is pretty simple.
To determine the strength or weakness of any index or equity, I first look at how they are performing in relation to the 9/20.
For the index or equity to be showing strength, it must, at the least, be above the 20 MA. A further sign of strength comes when the index or equity is also above the 9 EMA. And the best sign of strength comes when the 9 EMA crosses up through the 20 MA and both are pointing up. When the 9 EMA crosses up through the 20 MA that, to me, is a buy signal and is what I call a mini golden cross.
Conversely, a sign of weakness comes when an index or equity is trading first below the 9 EMA and next below the 20 MA. If an index or equity stays below the 20 MA for more than a day or two, then that will pull the 9 EMA down through the the 20 MA in what I call a mini death cross. This, then, becomes a sell signal.
So that is the skinny on the 9/20 cross. As mentioned above, it can be used on intra-day charts in any time frame you choose and is especially good in spotting weakness in the daily time frame.
Share your views
|
|
| Back to top |
|
 |
|
|
|
svkum
White Belt
Joined: 14 Feb 2007
Posts: 321
|
| Post: #2 Posted: Sat Aug 02, 2014 3:25 pm Post subject: |
|
|
| post max charts displaying you have successfully tested this strategy.
|
|
| Back to top |
|
|
anand512
White Belt
Joined: 26 Jun 2009
Posts: 109
|
| Post: #3 Posted: Sat Aug 02, 2014 4:32 pm Post subject: |
|
|
| i will post here as and when trade
|
|
| Back to top |
|
|
anand512
White Belt
Joined: 26 Jun 2009
Posts: 109
|
| Post: #4 Posted: Sat Aug 02, 2014 4:42 pm Post subject: |
|
|
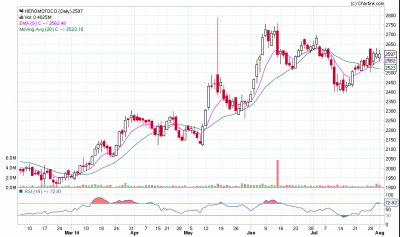
we can buy hero moto at CMP
| Description: |
|
| Filesize: |
72.97 KB |
| Viewed: |
652 Time(s) |
|
|
|
| Back to top |
|
|
anand512
White Belt
Joined: 26 Jun 2009
Posts: 109
|
| Post: #5 Posted: Sat Aug 02, 2014 4:56 pm Post subject: |
|
|
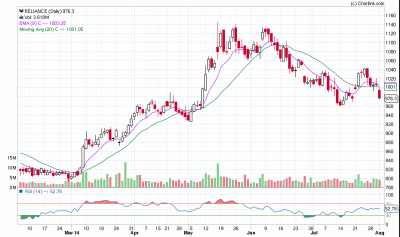
bearish cross over is going to take place
| Description: |
|
| Filesize: |
73.53 KB |
| Viewed: |
640 Time(s) |
|
|
|
| Back to top |
|
|
bhalchandra7117
White Belt
Joined: 16 Jan 2010
Posts: 71
|
| Post: #6 Posted: Sat Aug 02, 2014 7:32 pm Post subject: |
|
|
Sir, Reliance Chart failed Two time:
1. Sell around 22 April and
2. Buy around 23 July
Can't depend on your chart. Needs more accuracy
|
|
| Back to top |
|
|
amitagg
Black Belt

Joined: 01 Oct 2013
Posts: 4559
|
| Post: #7 Posted: Sat Aug 02, 2014 8:16 pm Post subject: |
|
|
| bhalchandra7117 wrote: | Sir, Reliance Chart failed Two time:
1. Sell around 22 April and
2. Buy around 23 July
Can't depend on your chart. Needs more accuracy |
One good idea to trade counter trade also if the crossover fails.
For instance, if reiiance is depicting negative crossover but that doe not work if price moves up over the next few days, then the failure may give long entry signal. Anand can clarify more.
|
|
| Back to top |
|
|
anand512
White Belt
Joined: 26 Jun 2009
Posts: 109
|
| Post: #8 Posted: Sat Aug 02, 2014 8:36 pm Post subject: |
|
|
In rangebound market there are some chances of whipshow.
But whenever trending mkt. we can remain in trade with trend and gives huge profit.
For more accuracy and confirmation of trend we can add some more indicators like RSI, MACD and CCI
for long entry RSI >50 ,CCI >50 and MACD positive divergence
similarly for short entry RSI<50 ,CCI <-50 and MACD negative divergence
Views from expert are welcome
|
|
| Back to top |
|
|
anand512
White Belt
Joined: 26 Jun 2009
Posts: 109
|
| Post: #9 Posted: Sat Aug 02, 2014 9:02 pm Post subject: |
|
|
one more imporatant thing to be kept in mind for long entry:
There should be cross over and both moving average should be pointing up and vice versa
|
|
| Back to top |
|
|
anand512
White Belt
Joined: 26 Jun 2009
Posts: 109
|
| Post: #10 Posted: Sat Aug 02, 2014 9:10 pm Post subject: |
|
|
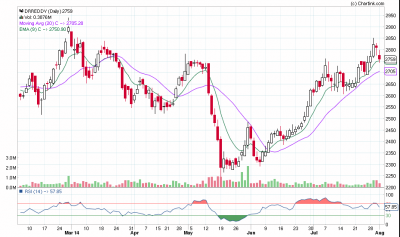
classical example of Dr. reddy lab
| Description: |
|
| Filesize: |
76.24 KB |
| Viewed: |
590 Time(s) |
|
|
|
| Back to top |
|
|
Hydrogen
White Belt
Joined: 18 Feb 2014
Posts: 87
|
| Post: #11 Posted: Sun Aug 03, 2014 9:18 am Post subject: |
|
|
Hi Anand512
Just a curiosity. Don't feel bad for my comment.
There is already a strategy known as 10/20 EMA trading system. Where Buy/Sell is taken on 10/20 cross-over system.
This 9 EMA & 20 MA crossover system. Why you have taken EMA & MA combination ? 9 EMA is almost near to 10 EMA. Can you please elaborate.
Other thing is that, is there any stop loss in your system ?
If you have already tested, then it will be very helpful for delivery trading for small traders like me. If yes then can you post your analysis.
|
|
| Back to top |
|
|
|


