| View previous topic :: View next topic |
| Author |
A B C D E F T - NITIN POTADE |
ndpotade
Yellow Belt

Joined: 05 Feb 2010
Posts: 580
|
Post: #16  Posted: Wed Jul 17, 2013 5:25 pm Post subject: Posted: Wed Jul 17, 2013 5:25 pm Post subject: |
 |
|
Thanks Shekhar & Prakashji...
It was my mistake.. My over confidence forced me for it.
|
|
| Back to top |
|
 |
|
|
 |
riteshucha
Green Belt

Joined: 19 May 2012
Posts: 1292
|
Post: #17  Posted: Thu Jul 18, 2013 5:42 pm Post subject: Posted: Thu Jul 18, 2013 5:42 pm Post subject: |
 |
|
sorry ndp for enquiring in the wrong thread.. but i couldnt find shekhar's thread.. this is for shekhar.. can u repost the chart which said mkt heading to 6070...
also can u update on the next likely move..
|
|
| Back to top |
|
 |
shekharinvest
Yellow Belt

Joined: 21 Dec 2007
Posts: 549
|
Post: #18  Posted: Thu Jul 18, 2013 7:37 pm Post subject: Posted: Thu Jul 18, 2013 7:37 pm Post subject: |
 |
|
| riteshucha wrote: | sorry ndp for enquiring in the wrong thread.. but i couldnt find shekhar's thread.. this is for shekhar.. can u repost the chart which said mkt heading to 6070...
also can u update on the next likely move.. |
riteshucha,
I presume you are referring to this thread :
http://www.icharts.in/forum/charts-und-patterns-t3178.html
There is nothing much to update, just follow and keep an eye on internal wave structures.
Hope it helps.
SHEKHAR
|
|
| Back to top |
|
 |
kingkrunal
White Belt

Joined: 22 Jun 2012
Posts: 498
|
Post: #19  Posted: Fri Jul 19, 2013 2:13 pm Post subject: Posted: Fri Jul 19, 2013 2:13 pm Post subject: |
 |
|
the strategy is good. but money management has to be done in one way or the other just my view
also .. is there any excel file to calculate this things?
nitin sir ??
|
|
| Back to top |
|
 |
ndpotade
Yellow Belt

Joined: 05 Feb 2010
Posts: 580
|
Post: #20  Posted: Mon Jul 29, 2013 6:41 am Post subject: Posted: Mon Jul 29, 2013 6:41 am Post subject: |
 |
|
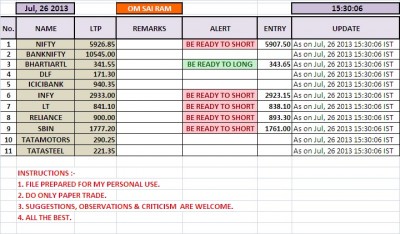
I HAVE PREPARED REALTIME FUTURE DATA FILE FOR INTRADAY TRADE BASED ON...
1 ) OPEN INTEREST.
2 ) LONG ABOVE PREVIOUS HIGH & SHORT BELOW PREVIOUS LOW.
3 ) CANDLE STICK OF PREVIOUS DAYS.
| Description: |
|
| Filesize: |
141.14 KB |
| Viewed: |
518 Time(s) |

|
|
|
| Back to top |
|
 |
ajit602
White Belt

Joined: 11 Sep 2012
Posts: 370
|
Post: #21  Posted: Mon Jul 29, 2013 9:19 am Post subject: Posted: Mon Jul 29, 2013 9:19 am Post subject: |
 |
|
| ndpotade wrote: | I HAVE PREPARED REALTIME FUTURE DATA FILE FOR INTRADAY TRADE BASED ON...
1 ) OPEN INTEREST.
2 ) LONG ABOVE PREVIOUS HIGH & SHORT BELOW PREVIOUS LOW.
3 ) CANDLE STICK OF PREVIOUS DAYS. |
sir please post this file.
thanks
|
|
| Back to top |
|
 |
ndpotade
Yellow Belt

Joined: 05 Feb 2010
Posts: 580
|
Post: #22  Posted: Sat Aug 10, 2013 7:54 pm Post subject: Posted: Sat Aug 10, 2013 7:54 pm Post subject: |
 |
|
Regarding Chart reading for intraday.
I use 5 minutes candles for intraday trading where I normally go for short sell.
[CONTENT REMOVED BY ADMIN]
This link will provide a list of stocks where Today's volume is greater than Previous Day's volume.
The site provides us list of stocks where unusual volume (comparision with Previous days's Volume ). Here we can say that new interest is generated in a stock.
For the list of stocks, I check chart of stocks where price is more than Rs.50/-
And I try to find support level of Stocks where I find big green (bullish candle) making new high of day with highest volume for the particular 5 minutes candle.
Then below the support level, I try to go for short sell for intraday with proper Stop Loss as per your risk appetite for small targets.
This is not one person's job. If anyone find a stock with unusual volume with Green Bullish candle and stock is moving near new high of day, we can try to find level for short sell.
I hope that few members will come forward for collective study & profit (individual)
|
|
| Back to top |
|
 |
pkholla
Black Belt

Joined: 04 Nov 2010
Posts: 2890
|
Post: #23  Posted: Sat Aug 10, 2013 8:00 pm Post subject: Posted: Sat Aug 10, 2013 8:00 pm Post subject: |
 |
|
Nitin: Have you tried ICharts screener facility? Should help you to screen and give you all the stocks that meet your criteria.
Screener (EOD): I tried
LastVol ... Greater Than ... 2*AvgVol
and LastPrice .... Greater Than ... 50
But too many stocks came in the list. Perhaps we can add more filters!
Rgds, Prakash Holla
|
|
| Back to top |
|
 |
ndpotade
Yellow Belt

Joined: 05 Feb 2010
Posts: 580
|
Post: #24  Posted: Fri Jan 24, 2014 7:13 pm Post subject: Posted: Fri Jan 24, 2014 7:13 pm Post subject: |
 |
|
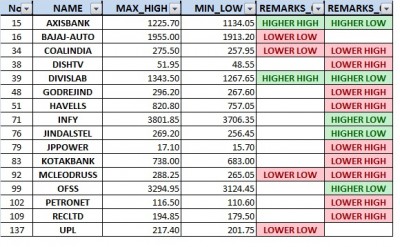
List of stocks where I have compared last 5 days data of future stocks. Hope this will be useful for trading.
| Description: |
|
| Filesize: |
114.12 KB |
| Viewed: |
461 Time(s) |

|
|
|
| Back to top |
|
 |
amitagg
Black Belt

Joined: 01 Oct 2013
Posts: 4559
|
Post: #25  Posted: Fri Jan 24, 2014 7:23 pm Post subject: Posted: Fri Jan 24, 2014 7:23 pm Post subject: |
 |
|
| ndpotade wrote: | | List of stocks where I have compared last 5 days data of future stocks. Hope this will be useful for trading. |
Pls clarify how of any help unless volume, change in OI data, or other chart factor also mentioned with actionable strategy...just asking since not seen previous posts in detail
|
|
| Back to top |
|
 |
ndpotade
Yellow Belt

Joined: 05 Feb 2010
Posts: 580
|
Post: #26  Posted: Sat Jan 25, 2014 6:01 am Post subject: Posted: Sat Jan 25, 2014 6:01 am Post subject: |
 |
|
| amitagg wrote: | | ndpotade wrote: | | List of stocks where I have compared last 5 days data of future stocks. Hope this will be useful for trading. |
Pls clarify how of any help unless volume, change in OI data, or other chart factor also mentioned with actionable strategy...just asking since not seen previous posts in detail |
This will be helpful for selection of stocks.
|
|
| Back to top |
|
 |
ndpotade
Yellow Belt

Joined: 05 Feb 2010
Posts: 580
|
Post: #27  Posted: Sat Jan 25, 2014 9:34 am Post subject: Posted: Sat Jan 25, 2014 9:34 am Post subject: |
 |
|
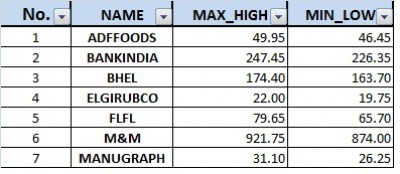
Last 5 days, volume is increasing.. CASH stocks :
| Description: |
|
| Filesize: |
34.55 KB |
| Viewed: |
423 Time(s) |

|
|
|
| Back to top |
|
 |
ndpotade
Yellow Belt

Joined: 05 Feb 2010
Posts: 580
|
Post: #28  Posted: Sat Jan 25, 2014 6:18 pm Post subject: Posted: Sat Jan 25, 2014 6:18 pm Post subject: |
 |
|
Please share your opinion about my findings.
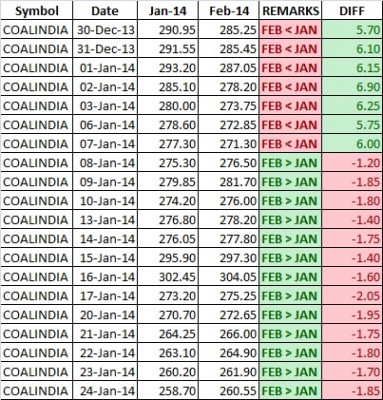
I am attaching image of data of COALINDIA - FUTURE for Jan'14 & Feb'14.
Normally we find that Next Month's Price is greater than Current Month's Price.
But due to dividend factor, CoalIndia was showing different picture. Was there any possibility to make profit by
1. SHORT JAN FUTURE & LONG FEB FUTURE ?
For the image, you can find that there was an opportunity to earn atleast Rs.8000 in a month on investment of Rs.80000/-.
May I right or something I am missing ?
Please share your opinion.
| Description: |
|
| Filesize: |
132.33 KB |
| Viewed: |
435 Time(s) |

|
|
|
| Back to top |
|
 |
vinay28
Black Belt

Joined: 24 Dec 2010
Posts: 11748
|
Post: #29  Posted: Sat Jan 25, 2014 6:32 pm Post subject: Posted: Sat Jan 25, 2014 6:32 pm Post subject: |
 |
|
| Nitin, I don't know the answer to your problem but what I do feel is that it satisfied my primary criterion of investment in aug'13 after it made a (at least) 3 year low. Though I don't invest in public sector companies, I feel it could go to about 320/360 in medium term. Presently it may come down to about 255/250 but is worth starting nibbling at.
|
|
| Back to top |
|
 |
ndpotade
Yellow Belt

Joined: 05 Feb 2010
Posts: 580
|
Post: #30  Posted: Sun Jan 26, 2014 6:51 pm Post subject: Posted: Sun Jan 26, 2014 6:51 pm Post subject: |
 |
|
| vinay28 wrote: | | Nitin, I don't know the answer to your problem but what I do feel is that it satisfied my primary criterion of investment in aug'13 after it made a (at least) 3 year low. Though I don't invest in public sector companies, I feel it could go to about 320/360 in medium term. Presently it may come down to about 255/250 but is worth starting nibbling at. |
I am not interested to know about trend for the stock. I want to know the view about hedging strategy discussed here.
|
|
| Back to top |
|
 |
|

