| View previous topic :: View next topic |
| Author |
A FUSION TRADING STRATEGY |
rk_a2003
Black Belt

Joined: 21 Jan 2010
Posts: 2734
|
Post: #271  Posted: Wed Mar 21, 2012 5:48 pm Post subject: Posted: Wed Mar 21, 2012 5:48 pm Post subject: |
 |
|
| sangi wrote: | | rk_a2003 wrote: | One can take position preferably on the same day of COG once it is confirmed.That's my view and preference and was proposed in fusion strategy.Taking a position on the second day is also ok.
Waiting to close above Lower trend line etc is like paying some insurance premium.Nothing wrong in that approach too. |
R.k.sir,
Hdil took position @ open today. 8.84% up today. thank u very much for this strategy and guidelines.
rgds,
sangi |
Happy to hear that Sangi,
Now you might have realized and experienced too the true power of this strategy.
You are doing well in identifying the trades. I should say very few people understood this strategy, otherwise there should be much more trades posted in this forum.
The first target in any fusion trade is middle B.B and then Upper trend line and finally the EPA .One may keep booking partial profits at different levels and keep Appropriate TSL to lock in the profits.
All the best!
|
|
| Back to top |
|
 |
|
|
 |
vinst
Black Belt

Joined: 09 Jan 2007
Posts: 3303
|
Post: #272  Posted: Sat Mar 24, 2012 10:14 am Post subject: Posted: Sat Mar 24, 2012 10:14 am Post subject: |
 |
|
| .... deleted .....
|
|
| Back to top |
|
 |
vinay28
Black Belt

Joined: 24 Dec 2010
Posts: 11748
|
Post: #273  Posted: Sat Mar 24, 2012 11:29 am Post subject: Posted: Sat Mar 24, 2012 11:29 am Post subject: |
 |
|
| rk, check your strategy for nifty pl
|
|
| Back to top |
|
 |
vishyvaranasi
Green Belt

Joined: 11 Jul 2011
Posts: 1159
|
Post: #274  Posted: Sat Mar 24, 2012 12:24 pm Post subject: Reliance EOD Posted: Sat Mar 24, 2012 12:24 pm Post subject: Reliance EOD |
 |
|
Hi RK , Vinay and other senior pros.Am unable to post chart . But reliance seems a good fusion candidate on a eod chart. So, pl. look and cnf.also how to paste the chart from icharts on a laptop.
Vishy
|
|
| Back to top |
|
 |
rk_a2003
Black Belt

Joined: 21 Jan 2010
Posts: 2734
|
Post: #275  Posted: Sat Mar 24, 2012 1:43 pm Post subject: Posted: Sat Mar 24, 2012 1:43 pm Post subject: |
 |
|
Vinay&Vishy
Both are not fusion candidates.Sorry!
|
|
| Back to top |
|
 |
sangi
White Belt

Joined: 19 Jan 2008
Posts: 69
|
Post: #276  Posted: Sun Mar 25, 2012 4:12 pm Post subject: Posted: Sun Mar 25, 2012 4:12 pm Post subject: |
 |
|
| sangi wrote: | Bhartiartl-eod.
chart attched. COG huge green candle and less volume. will wait for pullback if comes.
rgds,
Sangi |
Hi,
price reached UTL after a pullback.
rgds,
sangi
|
|
| Back to top |
|
 |
rk_a2003
Black Belt

Joined: 21 Jan 2010
Posts: 2734
|
Post: #277  Posted: Sun Mar 25, 2012 6:20 pm Post subject: Posted: Sun Mar 25, 2012 6:20 pm Post subject: |
 |
|
| Yes Sangi I too traded it.Two more candidates in pull back are Sterlite and HDIL.
|
|
| Back to top |
|
 |
rk_a2003
Black Belt

Joined: 21 Jan 2010
Posts: 2734
|
Post: #278  Posted: Sun Mar 25, 2012 7:57 pm Post subject: Posted: Sun Mar 25, 2012 7:57 pm Post subject: |
 |
|
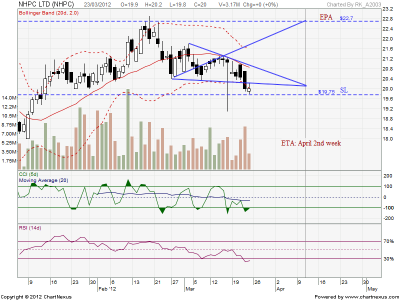
NHPC +Fusion trade triggered. SL on EOD basis.
It’s also a descending triangle pattern. One may take long entry ones it consistently trades above Lower Trend line (LTL). Alternatively in case it breaks SL on EOD basis; One may adapt SAR with a SL at Upper Trend Line( UTL) for a target of 18.50
| Description: |
|
| Filesize: |
45.75 KB |
| Viewed: |
290 Time(s) |
|
|
|
| Back to top |
|
 |
rk_a2003
Black Belt

Joined: 21 Jan 2010
Posts: 2734
|
Post: #279  Posted: Tue Mar 27, 2012 6:19 am Post subject: Posted: Tue Mar 27, 2012 6:19 am Post subject: |
 |
|
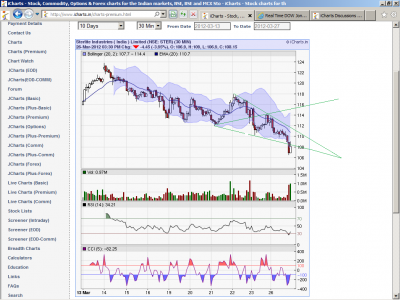
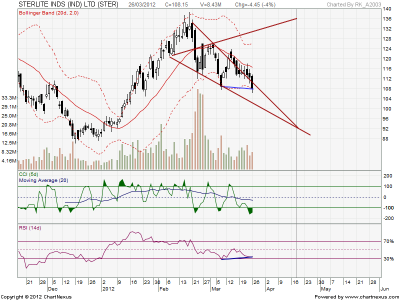
As anticipated Sterlite made a double bottom with RSI Div and also +Fusion trade Triggered in 30 Minute Chart.
An EOD + Fusion earlier.A double bottom with +ve Div on EOD charts.Again a +Fusion triggering in 30 Minutes Chart. QE3 from FED.That many factors won't favor a trade so often  .SL can be 106 On EOD basis. .SL can be 106 On EOD basis.
| Description: |
|
| Filesize: |
99.07 KB |
| Viewed: |
261 Time(s) |
|
| Description: |
|
| Filesize: |
52.77 KB |
| Viewed: |
268 Time(s) |
|
|
|
| Back to top |
|
 |
rk_a2003
Black Belt

Joined: 21 Jan 2010
Posts: 2734
|
Post: #280  Posted: Thu Mar 29, 2012 8:16 am Post subject: Posted: Thu Mar 29, 2012 8:16 am Post subject: |
 |
|
Just have a look at the chart.Nothing is yet confirmed.But a possible +WW.
| Description: |
|
| Filesize: |
53.69 KB |
| Viewed: |
296 Time(s) |
|
|
|
| Back to top |
|
 |
vishyvaranasi
Green Belt

Joined: 11 Jul 2011
Posts: 1159
|
Post: #281  Posted: Thu Mar 29, 2012 4:37 pm Post subject: Aban EOD Chart - Buy Generated Posted: Thu Mar 29, 2012 4:37 pm Post subject: Aban EOD Chart - Buy Generated |
 |
|
Hi RK,
Had looked into the chart closely and am posting here. I feel i might have come close to identifying the Strategy. If am wrong request to correct me where i had been wrong.
1. Its is a WW 2. Has more than four candles in WW4. 3. The last red candle tail is touching the LBB. 4. CCI is abv -100. 5. COG happened. 6. The vol is comparitvely better.
So, pl take time in going thru and revrt back.
Vishy
| Description: |
|

Download |
| Filename: |
Aban.doc |
| Filesize: |
135 KB |
| Downloaded: |
266 Time(s) |
| Description: |
|

Download |
| Filename: |
Aban.doc |
| Filesize: |
135 KB |
| Downloaded: |
265 Time(s) |
|
|
| Back to top |
|
 |
rk_a2003
Black Belt

Joined: 21 Jan 2010
Posts: 2734
|
Post: #282  Posted: Thu Mar 29, 2012 10:14 pm Post subject: Re: Aban EOD Chart - Buy Generated Posted: Thu Mar 29, 2012 10:14 pm Post subject: Re: Aban EOD Chart - Buy Generated |
 |
|
| vishyvaranasi wrote: | Hi RK,
Had looked into the chart closely and am posting here. I feel i might have come close to identifying the Strategy. If am wrong request to correct me where i had been wrong.
1. Its is a WW 2. Has more than four candles in WW4. 3. The last red candle tail is touching the LBB. 4. CCI is abv -100. 5. COG happened. 6. The vol is comparitvely better.
So, pl take time in going thru and revrt back.
Vishy |
Vishy
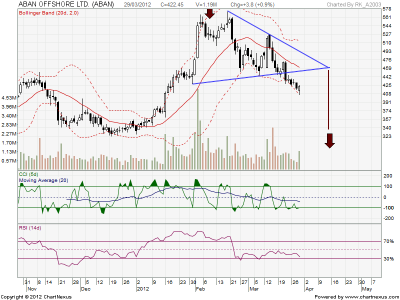
You have taken point 1 from middle of a wave. It is not acceptable. The points should be as distinct as possible.
See the chart, you have to draw the trend lines like this and then the pattern formed is not a ww. It's something similar to Descending Triangle with a break down happened. It’s moving down for a probable target of 336.
| Description: |
|
| Filesize: |
51.18 KB |
| Viewed: |
250 Time(s) |
|
|
|
| Back to top |
|
 |
vishyvaranasi
Green Belt

Joined: 11 Jul 2011
Posts: 1159
|
Post: #283  Posted: Fri Mar 30, 2012 8:49 am Post subject: Re: Aban EOD Chart - Buy Generated Posted: Fri Mar 30, 2012 8:49 am Post subject: Re: Aban EOD Chart - Buy Generated |
 |
|
| rk_a2003 wrote: | | vishyvaranasi wrote: | Hi RK,
Had looked into the chart closely and am posting here. I feel i might have come close to identifying the Strategy. If am wrong request to correct me where i had been wrong.
1. Its is a WW 2. Has more than four candles in WW4. 3. The last red candle tail is touching the LBB. 4. CCI is abv -100. 5. COG happened. 6. The vol is comparitvely better.
So, pl take time in going thru and revrt back.
Vishy |
Vishy
You have taken point 1 from middle of a wave. It is not acceptable. The points should be as distinct as possible.
See the chart, you have to draw the trend lines like this and then the pattern formed is not a ww. It's something similar to Descending Triangle with a break down happened. It’s moving down for a probable target of 336. |
,
Hi RK,
Thans a lot for your valuable advice. yes infact thats the only thing i felt wrong when i am drawing the trendlines. Infact i felt i am forcing the trendlines rather than finding them fit.
One particular doubt, any distinctive point (nedd not be too big a wave ) will be ok na
Vishy
|
|
| Back to top |
|
 |
vishyvaranasi
Green Belt

Joined: 11 Jul 2011
Posts: 1159
|
Post: #284  Posted: Fri Mar 30, 2012 9:56 am Post subject: RCOM EOD charts Posted: Fri Mar 30, 2012 9:56 am Post subject: RCOM EOD charts |
 |
|
Hi,
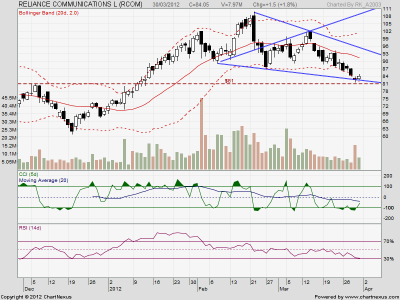
As per EOD charts of RCOm COG Seems to be happening now.So, i feel one can take position today
Vishy
|
|
| Back to top |
|
 |
rk_a2003
Black Belt

Joined: 21 Jan 2010
Posts: 2734
|
Post: #285  Posted: Sun Apr 01, 2012 8:45 pm Post subject: Posted: Sun Apr 01, 2012 8:45 pm Post subject: |
 |
|
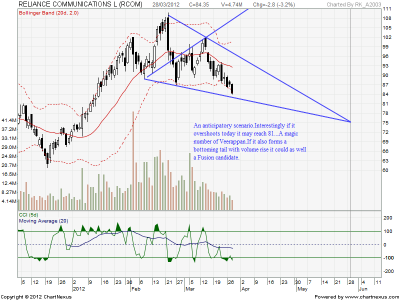
Yes you are right Vishy.Hope you took up the trade.A Fusion trade triggered in RCOM. SL is 81 on EOD basis.Latest chart attached.1st Target Middle B.B, 2nd UTL and the final is EPA.
| Description: |
|
| Filesize: |
50.46 KB |
| Viewed: |
301 Time(s) |
|
|
|
| Back to top |
|
 |
|

