|
|
| View previous topic :: View next topic |
| Author |
a layman's approach to break out and break down |
casper
Green Belt

Joined: 02 Oct 2010
Posts: 1315
|
Post: #1081  Posted: Wed Jan 05, 2011 5:47 pm Post subject: Posted: Wed Jan 05, 2011 5:47 pm Post subject: |
 |
|
i appreciate ur comment sherbaz sir
u r my senior and a better trader than me 
so what can i say more??? 
but perhaps i tried to mention something else in my post,
some thing which is more important to me than being merely "RIGHT" or "WRONG"
any way
thank u very much , at least u find some time to comment on my psot
|
|
| Back to top |
|
 |
|
|  |
casper
Green Belt

Joined: 02 Oct 2010
Posts: 1315
|
Post: #1082  Posted: Wed Jan 05, 2011 5:54 pm Post subject: Posted: Wed Jan 05, 2011 5:54 pm Post subject: |
 |
|
| beowulf wrote: | Hi Casper,
Let me assure you that NONE of your typing is in vain 
I'm sure everybody here really appreciates all the advice from you and other senior members.
Even Rakesh Jhunjhunwala makes a bad call once in a while. As newbies, we do tend to get emotional about some scripts, maybe we are related to some cos. in some ways or we have missed a chance to make good profits in the past and when the script jumps again, we want to make most of it, now our emotion does not allow to look at the imp factors. I guess everybody learns this way.
So please do provide inputs...a child learns to walk faster if elders hold their hand. But even elders cannot prevent the child from falling, children just pick themselves up and start again. Maybe this is the way to learn trading 
You know better  |
hiii beo
yes u r right, this is the way to learn
along with all of u, me also learnt, now learning and will learn even more from the market this way

|
|
| Back to top |
|
 |
drsureshbs
White Belt

Joined: 22 Oct 2008
Posts: 58
|
Post: #1083  Posted: Wed Jan 05, 2011 11:42 pm Post subject: Posted: Wed Jan 05, 2011 11:42 pm Post subject: |
 |
|
DEAR CASPER This is one post i can proudty say i learnt some thing. I think one think v all must now it is the market that drives the TA not the otherway . .TA tells u to change the gear immidietly. UR EFFORTS CERTAINLY MUST HAV BENEFITTED A LOT FOR SURE
Very much appricite ur sincerity.
dr suresh shetty
|
|
| Back to top |
|
 |
girishhu1
White Belt

Joined: 17 Aug 2009
Posts: 316
|
Post: #1084  Posted: Thu Jan 06, 2011 7:15 am Post subject: Posted: Thu Jan 06, 2011 7:15 am Post subject: |
 |
|
hellow casperji, in case of ashok leyland , i find support at 62 only on breaking of 67. however on 60m chart, the support may come at 65.5,63.45 and 62.25 (jchart premium levels ) kindly confirm
regards,
girish
|
|
| Back to top |
|
 |
casper
Green Belt

Joined: 02 Oct 2010
Posts: 1315
|
Post: #1085  Posted: Thu Jan 06, 2011 9:04 am Post subject: Posted: Thu Jan 06, 2011 9:04 am Post subject: |
 |
|
| girishhu1 wrote: | hellow casperji, in case of ashok leyland , i find support at 62 only on breaking of 67. however on 60m chart, the support may come at 65.5,63.45 and 62.25 (jchart premium levels ) kindly confirm
regards,
girish |
as per my real time chart-jchart basic, i am getting the same level of support. i. e 65/63.45and 62
|
|
| Back to top |
|
 |
casper
Green Belt

Joined: 02 Oct 2010
Posts: 1315
|
Post: #1086  Posted: Thu Jan 06, 2011 9:05 am Post subject: Posted: Thu Jan 06, 2011 9:05 am Post subject: |
 |
|
| drsureshbs wrote: | DEAR CASPER This is one post i can proudty say i learnt some thing. I think one think v all must now it is the market that drives the TA not the otherway . .TA tells u to change the gear immidietly. UR EFFORTS CERTAINLY MUST HAV BENEFITTED A LOT FOR SURE
Very much appricite ur sincerity.
dr suresh shetty |
hii drsureshsbs
after a very long time !!!!!!!
thanks and welcome 
|
|
| Back to top |
|
 |
casper
Green Belt

Joined: 02 Oct 2010
Posts: 1315
|
Post: #1087  Posted: Thu Jan 06, 2011 10:05 am Post subject: Posted: Thu Jan 06, 2011 10:05 am Post subject: |
 |
|
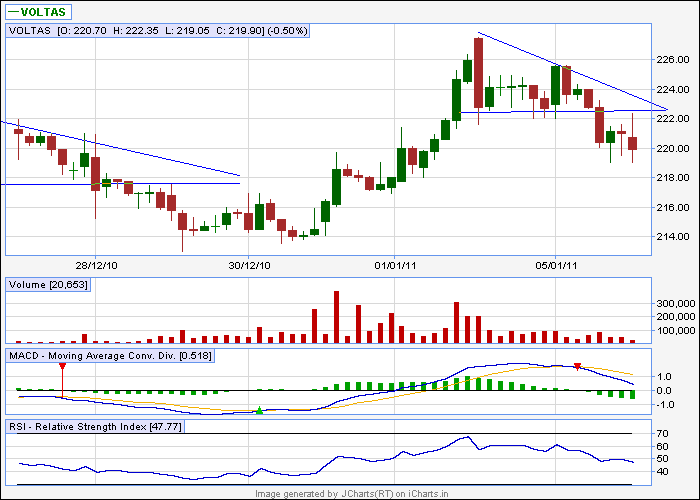
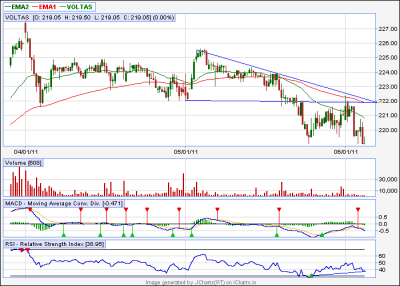
this chart is for study purpose only
voltas descending triangle
already broken out
the curious thing is, we have strong positive divergence in lower tfs
i expect it to go up to bd level, viz 222 level again and if it get rejected from that level again, then will come down to monthly support at 218
let us see what happens here
| Description: |
|
| Filesize: |
10.18 KB |
| Viewed: |
817 Time(s) |
|
| Description: |
|
| Filesize: |
13.09 KB |
| Viewed: |
189 Time(s) |
|
|
|
| Back to top |
|
 |
as4manju
White Belt

Joined: 22 Mar 2007
Posts: 390
|
Post: #1088  Posted: Thu Jan 06, 2011 10:13 am Post subject: Posted: Thu Jan 06, 2011 10:13 am Post subject: |
 |
|
Hi casper,
Your doing a good job of educating pepole keep doing it.. would like to all readers who follow the calls casper n others who post their work in these threads that there is nothing called as free lunch as such nor there any holly grail to make money every thing comes with a risk so plz stress on momeny management in each and every trades of urs cause ultimately its sad to some loosing money based on our calls.. so trade with strict stops
Regards
| casper wrote: | | casper wrote: | an analysis of ICICI bank as of 4th January 6.20 pm
i was not asked this question, still i am trying to describe how i see icici bank now. if one of my brothers gets trapped as higher as 1150 and still holds icici bank then the situation becomes quite indigestible for me.
icici closed around 1104, being a basic member, my chart is not updated, so i have marked the zone with dark color in the chart
at this level, we see the lower band of the bollinger band and 23% of fib retracement of previous up move stays. so here we expect a good support
the 5 min and 15 min break up of icici data shows a strong positive divergence which may signal for some up move, not a robust move, still some up move, my experience says it can go up to weekly s1
at the same time we have a double top formation at 1150 level which has broken down today,
now joining the fact of support and double top, we can safely assume that if the stock holds 1100 level then can go up to 1120
and if this stock breaks below 1100, we can expect 1050
now, let us think about what may happen tomorrow and how can we tackle the situation
1. suppose it is holding 1100, then with the stop loss of weekly s2 at 1092, we can buy some more to average our existing position and book the total position at weekly s1 at 1120 or monthly pivot at 1125
2. suppose it is broken down from1100 level then we can buy put of 1100 and target 1050 or wherever it stops, in this case we would not close the 1150 buy position we already have
let icici take support, we will sell the put with good profit and buy another lot of icici in future to average our existing position
then we can sell it when it retrace back to 1100-1125 level again in coming days
that is the two possibilities i can see now
at last i would like to say something
sumesh and vishy is service holder, i have a small business, we all remains very busy with our work and our trading also, it is not easy to find set ups and post that everyday. still we do this. just to see some happy faces of our brothers at the end of days. just to have the reason to smile together and enjoy whatever lil bit we can earn from the market this way. we have no intention and practically no reason to advertise ourselves as "experts", all we do is out of our passion for T.A and with a feelings to share whatever we can through this media.
but if any of u take our calls without adhering to proper risk management it can turn the whole thing upside down and ruins our days
because we like to be clear before our inner-selves, so we just cant wash out our hands saying "why he has traded this call? i hav not forced any body!!!! "
so plz, to keep the things going, help us by using stop loss |
so much thinking so much typing all seems to be in vein 
those who are supposed to make profit will make profit and those who are supposed to make loss is making loss
anna was telling me in morning " why are u taking things so personally? dont dictate any one and let them decide what to do, afer all its their money, not urs, so they will decide. u better not force any one"
i was arguing with him. may be i have hurt him also, but looking at the situation, i think he is right. it is said "always listen to seniors" its true 
LOOKING AT THE SITUATION, I FEEL, FOR THE GUY I WROTE COVERING ALL THE ASPECTS, IS STILL HOLDING ICICI WITH OUT DOING ANY THING
i am sorry, this is not a market related post. this is just what i felt, and since it is not my personal blog website so i think i would better not write this post
but then i want to be genuine and i really feel that we are a family, thats why writing all these. 
u can ignore this post as well, sorry for wasting ur time
but when every one is making more or less money, but one of us is making huge loss, somewhere in me something pricks. this is the reason of this post |
|
|
| Back to top |
|
 |
casper
Green Belt

Joined: 02 Oct 2010
Posts: 1315
|
Post: #1089  Posted: Thu Jan 06, 2011 11:22 am Post subject: Posted: Thu Jan 06, 2011 11:22 am Post subject: |
 |
|
hiiii as4manju
thank u for ur kind words
we are working on real time data and getting updated in every second
but u, with the help of only eod charts and simple trend lines, just doing wonder day after day
this is just incredible, in fact u r turning the almost impossible into very possible
hat's off to u 
|
|
| Back to top |
|
 |
casper
Green Belt

Joined: 02 Oct 2010
Posts: 1315
|
Post: #1090  Posted: Thu Jan 06, 2011 11:28 am Post subject: Posted: Thu Jan 06, 2011 11:28 am Post subject: |
 |
|
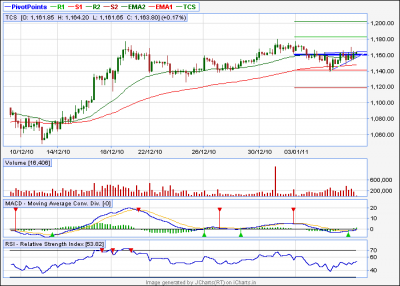
tcs
ascending triangle
a break above 1165 can reach us up to 1180
plz use strict stop loss
any hourly candle close below bo level is sl
i am quoting one of my favorite quotes here
"trade for profit, not for target'
so plz trail ur sl also
| Description: |
|
| Filesize: |
13.62 KB |
| Viewed: |
195 Time(s) |
|
|
|
| Back to top |
|
 |
casper
Green Belt

Joined: 02 Oct 2010
Posts: 1315
|
Post: #1091  Posted: Thu Jan 06, 2011 12:04 pm Post subject: Posted: Thu Jan 06, 2011 12:04 pm Post subject: |
 |
|
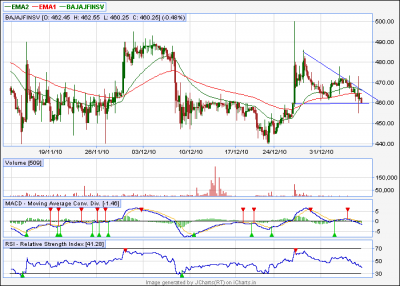
bajajfinsv
a big dt , break down below 460, sell with a bd only
no support is seen up to 440
(i wonder why it has not broken yet, i hv not expected to find a dt in this already bearish market, all dts are supposed to be broken already, is it a trap? but looks good, trade with strict stop loss)
ANY CANDLE CLOSE ABOVE THE BO LEVEL IS STOP LOSS, WE USE 60 MIN TF ONLY
| Description: |
|
| Filesize: |
16.8 KB |
| Viewed: |
195 Time(s) |
|
|
|
| Back to top |
|
 |
as4manju
White Belt

Joined: 22 Mar 2007
Posts: 390
|
Post: #1092  Posted: Thu Jan 06, 2011 12:28 pm Post subject: Posted: Thu Jan 06, 2011 12:28 pm Post subject: |
 |
|
Hi casper,
It feels good to be a part such forum where wealth and information is shared for free of cost.. so lets keep posting and share what we know..
Regards
Manju
| casper wrote: | hiiii as4manju
thank u for ur kind words
we are working on real time data and getting updated in every second
but u, with the help of only eod charts and simple trend lines, just doing wonder day after day
this is just incredible, in fact u r turning the almost impossible into very possible
hat's off to u  |
|
|
| Back to top |
|
 |
casper
Green Belt

Joined: 02 Oct 2010
Posts: 1315
|
Post: #1093  Posted: Thu Jan 06, 2011 12:29 pm Post subject: Posted: Thu Jan 06, 2011 12:29 pm Post subject: |
 |
|
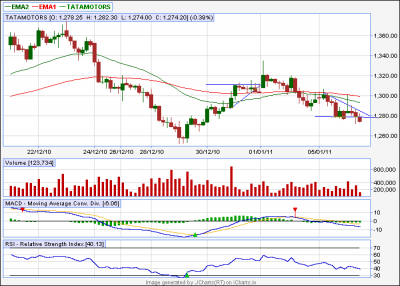
tatamotors
a dt already broken
can be shorted here
target 1260
sl any close above 1280, cmp 1274
| Description: |
|
| Filesize: |
12.52 KB |
| Viewed: |
183 Time(s) |
|
|
|
| Back to top |
|
 |
ali522003
White Belt

Joined: 03 Jul 2010
Posts: 217
|
Post: #1094  Posted: Thu Jan 06, 2011 12:38 pm Post subject: unable to detect the stop loss. please help to find Posted: Thu Jan 06, 2011 12:38 pm Post subject: unable to detect the stop loss. please help to find |
 |
|
| casper wrote: | tcs
ascending triangle
a break above 1165 can reach us up to 1180
plz use strict stop loss
any hourly candle close below bo level is sl
i am quoting one of my favorite quotes here
"trade for profit, not for target'
so plz trail ur sl also |
|
|
| Back to top |
|
 |
casper
Green Belt

Joined: 02 Oct 2010
Posts: 1315
|
Post: #1095  Posted: Thu Jan 06, 2011 12:51 pm Post subject: Posted: Thu Jan 06, 2011 12:51 pm Post subject: |
 |
|
ali
i could not understand what u meant
but seeing ur post subject (which i generally avoid). it looks like u hv prb in tcs
as per my drawing, the bo level in tcs is 1163. if an hourly candle closes below 1163, i repeat, CLOSES BELOW 1163, then i would think that my sl is hit and i would sell out my position to avoid further loss
currently it is trading at 1162, below my sl lvel, but the candle is yet to close,
the current candle will close at 1pm
if the closing price stays below 1163 then i will sell,
if closing price e is above the level then i will continue holding it
in any case, if and only if price comes down VERY FAST then only i will consider selling before candle close
i am holding it at 1064 level
|
|
| Back to top |
|
 |
|
|
You cannot post new topics in this forum
You cannot reply to topics in this forum
You cannot edit your posts in this forum
You cannot delete your posts in this forum
You cannot vote in polls in this forum
You can attach files in this forum
You can download files in this forum
|
Powered by phpBB © 2001, 2005 phpBB Group
|
|
|

