|
|
| View previous topic :: View next topic |
| Author |
a layman's approach to break out and break down |
casper
Green Belt

Joined: 02 Oct 2010
Posts: 1315
|
Post: #1156  Posted: Sat Jan 08, 2011 1:16 pm Post subject: Re: LT-breakdown Posted: Sat Jan 08, 2011 1:16 pm Post subject: Re: LT-breakdown |
 |
|
| bassan wrote: | Hi Casper,
your view on LT Pls.Chart enclosed. |
hi bassan, as per my chart, i see monthly support at 1840
dont sell it further until it breaks this level
in real time charts. ranging from 60min to 5 min tf. i see rsi is heavily oversold. i expect some short covering and pull back here before going down
i feel if it pulls back up to 1900 max. then when it get rejected by 34/89 ema we can sell it again with a target of 1840 and a stop loss of a 1920 aprox
but if it breaches 1840 with a candle close below this level in 60 min chart, we can sell it again
|
|
| Back to top |
|
 |
|
|  |
bassan
White Belt

Joined: 01 Dec 2009
Posts: 57
|
Post: #1157  Posted: Sat Jan 08, 2011 2:10 pm Post subject: Posted: Sat Jan 08, 2011 2:10 pm Post subject: |
 |
|
Thanks for your valuable guidance, CASPER. 
|
|
| Back to top |
|
 |
sherbaaz
Yellow Belt

Joined: 27 May 2009
Posts: 543
|
Post: #1158  Posted: Sun Jan 09, 2011 12:53 am Post subject: Re: LT-breakdown Posted: Sun Jan 09, 2011 12:53 am Post subject: Re: LT-breakdown |
 |
|
| bassan wrote: | Hi Casper,
your view on LT Pls.Chart enclosed. |
Hi,
I hope I am not interfering as Q is asked to casper.
The downward sloping trend line in your chart is not right. u may end up with wrong interpretation. this tl has been breached couple of times so it is not valid for analysis.
Regards,
|
|
| Back to top |
|
 |
casper
Green Belt

Joined: 02 Oct 2010
Posts: 1315
|
Post: #1159  Posted: Sun Jan 09, 2011 8:33 am Post subject: Re: LT-breakdown Posted: Sun Jan 09, 2011 8:33 am Post subject: Re: LT-breakdown |
 |
|
| sherbaaz wrote: | | bassan wrote: | Hi Casper,
your view on LT Pls.Chart enclosed. |
Hi,
I hope I am not interfering as Q is asked to casper.
The downward sloping trend line in your chart is not right. u may end up with wrong interpretation. this tl has been breached couple of times so it is not valid for analysis.
Regards, |
sherbaz bhai u r right and plz take a look of what i replied to bassan
i have not taken this tl in my consideration during analysis
that is not a very valid trend line indeed
  
|
|
| Back to top |
|
 |
singh.ravee
Yellow Belt

Joined: 12 Aug 2010
Posts: 678
|
Post: #1160  Posted: Sun Jan 09, 2011 10:12 am Post subject: Posted: Sun Jan 09, 2011 10:12 am Post subject: |
 |
|
casper hello,
Ref: your reply to bassan on L&T.
If i look at LT 60min tf, second last candle is doji and last candle is a tall bearish candle. Both candles are high volume. I interpret it in this way; on doji the bulls try to balance the downmove as downmove was coming close to monthly support of 1840. Very next candle the bears took over bulls and they were able to push price below 1840. The increased volume on last candle suggest the power behind the action of bears. I feel the possibility of pullback in this case is low.
Since, one of my friend is short on l&t from 1980 level, I have advised him to keep his short positon open. After reading your reply, i felt i should advise him to cover and then reenter.
Kindly clarify.
thanks and regards
ravee
|
|
| Back to top |
|
 |
singh.ravee
Yellow Belt

Joined: 12 Aug 2010
Posts: 678
|
Post: #1161  Posted: Sun Jan 09, 2011 10:19 am Post subject: Posted: Sun Jan 09, 2011 10:19 am Post subject: |
 |
|
casper bhai,
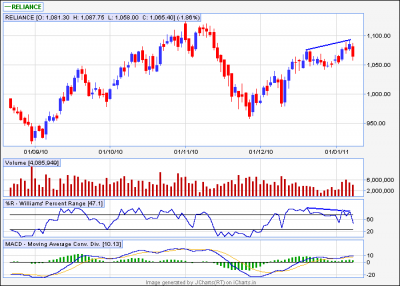
is it bearish divergence on reliance in eod tf.
thanks and regards
ravee
| Description: |
|
| Filesize: |
11.74 KB |
| Viewed: |
207 Time(s) |
|
|
|
| Back to top |
|
 |
vishytns
White Belt

Joined: 26 Nov 2009
Posts: 206
|
Post: #1162  Posted: Sun Jan 09, 2011 10:28 am Post subject: Posted: Sun Jan 09, 2011 10:28 am Post subject: |
 |
|
Ravee/Casper,
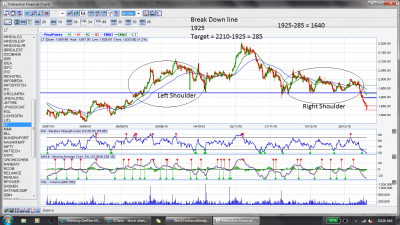
Word of caution in LT. We have head and shoulders broken. Retracement to break down line has not happened, so we can expect retracement to break down line 1925.
Once the retracement happens one can go short at 1925 with stop loss based on your risk. You can exit shorts and enter long positions if it sustains above break down line for atleast an hour.
I have attached the chart. Please comment.
Vishy
| Description: |
|
| Filesize: |
200.36 KB |
| Viewed: |
206 Time(s) |
|
|
|
| Back to top |
|
 |
casper
Green Belt

Joined: 02 Oct 2010
Posts: 1315
|
Post: #1163  Posted: Sun Jan 09, 2011 10:36 am Post subject: Posted: Sun Jan 09, 2011 10:36 am Post subject: |
 |
|
one thing u know ravee that after 3.30 pm i mean after closing of our daily transaction, the institutional players and brokers have their extensive time span for 30 minutes or so(i forget exactly how many minutes they get, but they DO get this time)
for this reason, if u see in any nse /bse website after 3.30pm u will find all numbers are provisional because after this so called "auction" of big boys we get our final closing prices
now let us jump to the charts
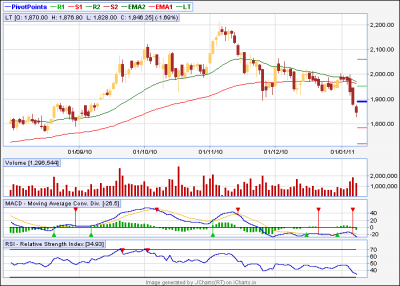
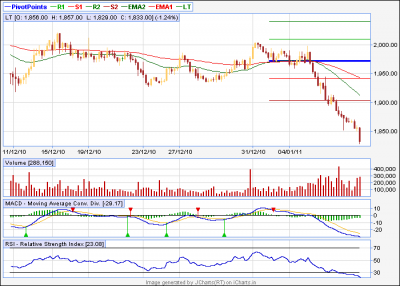
we have closing of LT in real time charts as 1833, which has clearly closed below the monthly support of 1840, going by this,ur assumption of carrying short is correct
but if we see in daily charts, we will see the closing is at 1846, so our monthly support is intact
thats why we need a break below this 1840 to enter another short
and now if ur friend is holding this short then he can do nothing but to watch out in the morning hours of Monday to see what LT is doing
suppose i have a open short then, PERSONALLY, i would see if it is going below 1840 on Monday or not, if it is going below that or showing weakness then i would stay with my position and if i see any bounce back, then i would use the nearest resistance available as my stop loss for this short,
THIS IS JUST MY PERSONAL OPINION
| Description: |
|
| Filesize: |
13.07 KB |
| Viewed: |
208 Time(s) |
|
|
|
| Back to top |
|
 |
casper
Green Belt

Joined: 02 Oct 2010
Posts: 1315
|
Post: #1164  Posted: Sun Jan 09, 2011 10:37 am Post subject: Posted: Sun Jan 09, 2011 10:37 am Post subject: |
 |
|
forgot to attach the real time chart, 60min tf
| Description: |
|
| Filesize: |
13.3 KB |
| Viewed: |
193 Time(s) |
|
|
|
| Back to top |
|
 |
singh.ravee
Yellow Belt

Joined: 12 Aug 2010
Posts: 678
|
Post: #1165  Posted: Sun Jan 09, 2011 10:41 am Post subject: Posted: Sun Jan 09, 2011 10:41 am Post subject: |
 |
|
casper,
thank you so much for prompt reply. 1840 is the trump card for l&t.
rgds
ravee
|
|
| Back to top |
|
 |
casper
Green Belt

Joined: 02 Oct 2010
Posts: 1315
|
Post: #1166  Posted: Sun Jan 09, 2011 10:46 am Post subject: Posted: Sun Jan 09, 2011 10:46 am Post subject: |
 |
|
| vishytns wrote: | Ravee/Casper,
Word of caution in LT. We have head and shoulders broken. Retracement to break down line has not happened, so we can expect retracement to break down line 1925.
Once the retracement happens one can go short at 1925 with stop loss based on your risk. You can exit shorts and enter long positions if it sustains above break down line for atleast an hour.
I have attached the chart. Please comment.
Vishy |
though i hv not identified H/S in my post, but i expected this kinds of retracement and told bassan to enter only if it breach 1840 or retrace up to 1900 aprox and get rejected by 89/34 ema present around this level
i see that monthly s1 is present at 1909 or so and 34 ema is hovering above that, thats why i expect it to get resistance here and go down again
if we expect it to reach 1925 then it will need some power packed move to breach monthly s1 and if it does so, then the chance of going down agin and breach monthly s1 again to make new low will be very narrow
what u think about it vishy? now u plz comment
 
|
|
| Back to top |
|
 |
singh.ravee
Yellow Belt

Joined: 12 Aug 2010
Posts: 678
|
Post: #1167  Posted: Sun Jan 09, 2011 10:55 am Post subject: Posted: Sun Jan 09, 2011 10:55 am Post subject: |
 |
|
casper bhai,
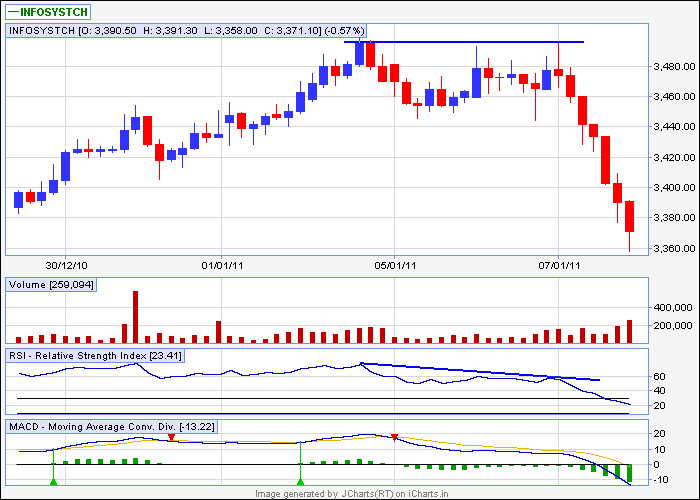
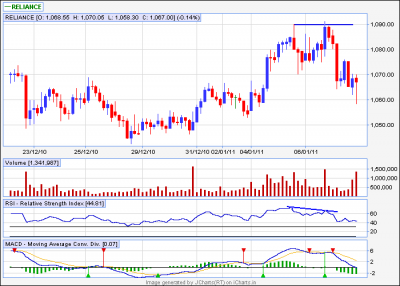
i m attaching charts of infosys and reliance on 60 min tf showing divergence, If I have spotted it right. Although the action has happened, however divergence as a trading tool can be used for any future trade.
Sharing this with you just to express my thanks to you, for making me aware about this trading tool.
rgds
ravee
| Description: |
|
| Filesize: |
9.57 KB |
| Viewed: |
906 Time(s) |
|
| Description: |
|
| Filesize: |
11.72 KB |
| Viewed: |
199 Time(s) |
|
|
|
| Back to top |
|
 |
casper
Green Belt

Joined: 02 Oct 2010
Posts: 1315
|
Post: #1168  Posted: Sun Jan 09, 2011 10:57 am Post subject: Posted: Sun Jan 09, 2011 10:57 am Post subject: |
 |
|
| singh.ravee wrote: | casper bhai,
is it bearish divergence on reliance in eod tf.
thanks and regards
ravee |
yes ravee as per williams% R, we have a negative divergence in this chart
now we can see, with a red candle, this divergence is started paying off
one thing to remember, that no divergence gives us any price target from itself, it only tells us the possible price direction
for price targets i prefer to use support/resistance levels in the chart
as per the chart we have very strong support around 1035-1050 level,as 34/89 ema and monthly piv and weekly s1( next week's s1, not the last week's s1) is present
so we can safely assume that we will have the down move only up to this level max
|
|
| Back to top |
|
 |
casper
Green Belt

Joined: 02 Oct 2010
Posts: 1315
|
Post: #1169  Posted: Sun Jan 09, 2011 11:07 am Post subject: Posted: Sun Jan 09, 2011 11:07 am Post subject: |
 |
|
| singh.ravee wrote: | casper bhai,
i m attaching charts of infosys and reliance on 60 min tf showing divergence, If I have spotted it right. Although the action has happened, however divergence as a trading tool can be used for any future trade.
Sharing this with you just to express my thanks to you, for making me aware about this trading tool.
rgds
ravee |
perfectly spotted ravee, u have learnt it realty fast!!! wish u much more success in coming days
  
|
|
| Back to top |
|
 |
mrvishal_g
White Belt

Joined: 17 Sep 2010
Posts: 89
|
Post: #1170  Posted: Sun Jan 09, 2011 6:35 pm Post subject: Posted: Sun Jan 09, 2011 6:35 pm Post subject: |
 |
|
Hi Casper,
What is your opinion on following:
SAIL 179--------SELL BELOW 177 (ST BD)
IDFC 168.9.........BUY DUE TO ITS FRIDAY CANDLE and SUPPORT NEAR 165
INDIABULLS REALESTATE 125......IT RETURN BACK TO 125 AFTER MAKING HIGH 140, IS IT STILL NVK SETUP OR NOW IT LOOKING DT MORE
VISHAL
|
|
| Back to top |
|
 |
|
|
You cannot post new topics in this forum
You cannot reply to topics in this forum
You cannot edit your posts in this forum
You cannot delete your posts in this forum
You cannot vote in polls in this forum
You can attach files in this forum
You can download files in this forum
|
Powered by phpBB © 2001, 2005 phpBB Group
|
|
|

