|
|
| View previous topic :: View next topic |
| Author |
a layman's approach to break out and break down |
casper
Green Belt

Joined: 02 Oct 2010
Posts: 1315
|
Post: #1171  Posted: Sun Jan 09, 2011 7:49 pm Post subject: Posted: Sun Jan 09, 2011 7:49 pm Post subject: |
 |
|
hiii vishal
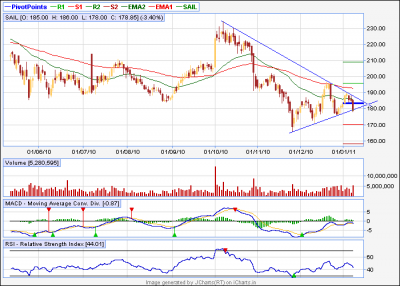
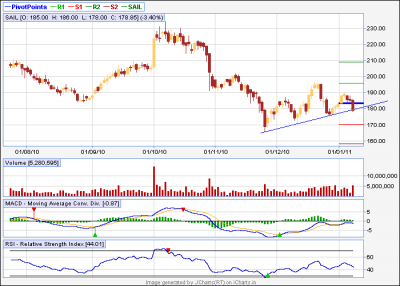
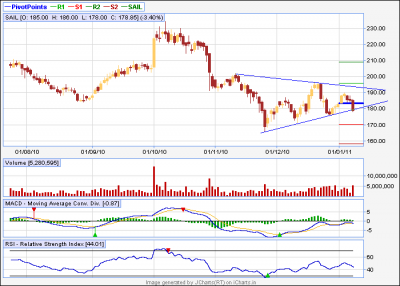
1. SAIL= my symmetrical triangle is still intact, lets break it for a position, it may happen tomorrow
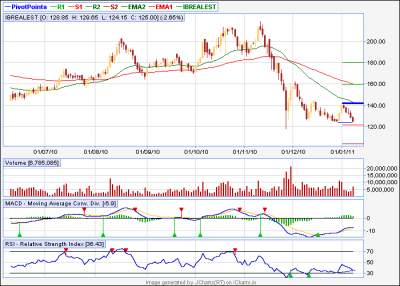
2.IBREALEST= price is near the monthly support of 120 and we have a positive divergence in daily rsi, i think we can buy it for 135-140 and with a stop loss below 120 by closing
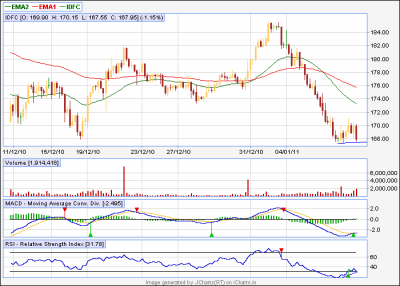
3.IDFC= apart from ur mentioned reasons, i am giving u another reason to buy it. it is real time 60 minutes chart
see in the chart, what a positive divergence it has got!!!
target should be 172,176 and 180 and stop loss should be 160 (monthly support is 164 aprox)
| Description: |
|
| Filesize: |
15.91 KB |
| Viewed: |
184 Time(s) |
|
| Description: |
|
| Filesize: |
13.91 KB |
| Viewed: |
197 Time(s) |
|
| Description: |
|
| Filesize: |
14.38 KB |
| Viewed: |
173 Time(s) |
|
|
|
| Back to top |
|
 |
|
|  |
Ravi_S
Yellow Belt

Joined: 15 Jun 2009
Posts: 569
|
Post: #1172  Posted: Sun Jan 09, 2011 8:40 pm Post subject: Posted: Sun Jan 09, 2011 8:40 pm Post subject: |
 |
|
Casper
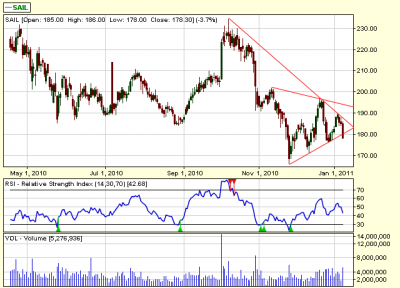
Look at the way I've interpreted SAIL... I"ve taken spot Chart... If you have a close look, there is another trend line drawn below your line... which forms another symmetrical triangle. However, if you see there is a
also a good H&S pattern and the neckline has already been broken... There is a good 14 points to be taken below the breakout which is at 180.. This is also the previous low formed on Nov 25. Let me know your thoughts.
Regards
Ravi
| casper wrote: | hiii vishal
1. SAIL= my symmetrical triangle is still intact, lets break it for a position, it may happen tomorrow
2.IBREALEST= price is near the monthly support of 120 and we have a positive divergence in daily rsi, i think we can buy it for 135-140 and with a stop loss below 120 by closing
3.IDFC= apart from ur mentioned reasons, i am giving u another reason to buy it. it is real time 60 minutes chart
see in the chart, what a positive divergence it has got!!!
target should be 172,176 and 180 and stop loss should be 160 (monthly support is 164 aprox) |
| Description: |
|
| Filesize: |
19.6 KB |
| Viewed: |
200 Time(s) |
|
|
|
| Back to top |
|
 |
casper
Green Belt

Joined: 02 Oct 2010
Posts: 1315
|
Post: #1173  Posted: Sun Jan 09, 2011 9:07 pm Post subject: Posted: Sun Jan 09, 2011 9:07 pm Post subject: |
 |
|
Yes ravi sir,
This is very much possible, in fact for target projection, the triangle u mentioned is more appropriate than mine
i did not posted it because, in case of a BD from this triangle, the BD will come some what, from the middle part of the triangle, not from the tip, which we usually get.so the pattern would look some what flattened, (which would not be a classical pattern also) otherwise, no problem with this pattern at all!!
along with that ST, i am posting the H/S version of the chart also. did u mean this one?
it is a little slopped up but looks like the 178 level or the lower trend line(neck line in case of h/s) holds the key of further moves
| Description: |
|
| Filesize: |
11.98 KB |
| Viewed: |
172 Time(s) |
|
| Description: |
|
| Filesize: |
12.14 KB |
| Viewed: |
166 Time(s) |
|
|
|
| Back to top |
|
 |
Allwell
White Belt

Joined: 24 Jan 2010
Posts: 183
|
Post: #1174  Posted: Sun Jan 09, 2011 9:28 pm Post subject: Posted: Sun Jan 09, 2011 9:28 pm Post subject: |
 |
|
Hi, Casper,
love to know ur view on Bajaj Auto and Tata Motors
|
|
| Back to top |
|
 |
casper
Green Belt

Joined: 02 Oct 2010
Posts: 1315
|
Post: #1175  Posted: Sun Jan 09, 2011 10:10 pm Post subject: Posted: Sun Jan 09, 2011 10:10 pm Post subject: |
 |
|
| dijyya wrote: | Hi, Casper,
love to know ur view on Bajaj Auto and Tata Motors |
hi dijyya
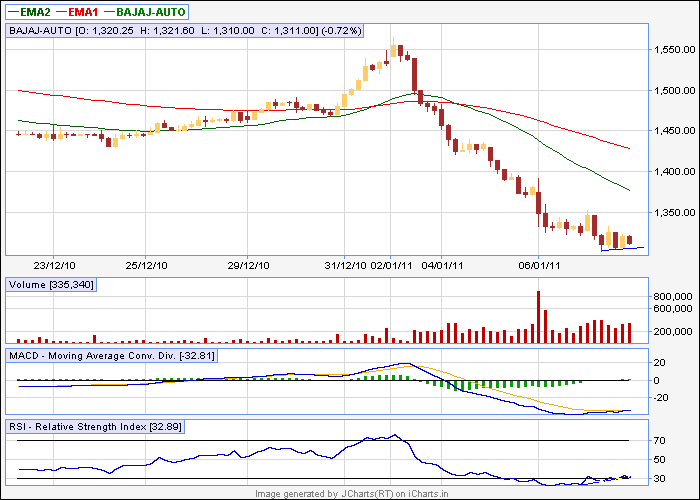
both are very confusing to me, bajaj-auto in 60 min tf has very strong positive divergence. i dont understand nvk properly but it looks like a sort of nvk,
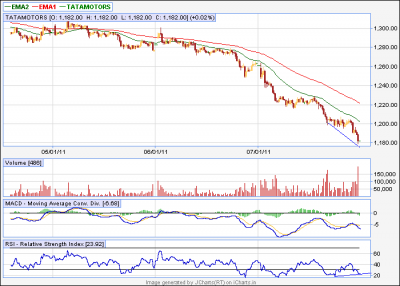
and tata motors too, though in 5 min tf and not nvk like situation, but has some strong divergence
now a days sumesh bhai is absent or else i would definitely ask him to confirm at least bajaj-auto and some other stocks
now as both of them have broken their uptrend line so i am not bullish but in the light of the positive divergence, i can not be bearish either (specially for bajaj-auto)
tomorrow i expect bajaj-auto to reach 1335, if it breaks and stays above this level for an hour, we can get 1370-1380 range
for tatamotors i expect it to reach 1200 level
I HAVE SEEN SOME STRONG POSITIVE DIVERGENCE IN SOME OF THE STOCKS, MY LIST IS NOT FINISHED YET AND I WILL POST IT WHEN I FINISH CHECKING
I WANT TO TELL EVERYONE, THAT THOUGH I AM NOT BULLISH BUT I DO EXPECT SOME PULLBACK OR GAP UP OPENING TOMORROW
IN CASE OF GAP UP, GOING DOWN IS LIKELY AND IN CASE OF NORMAL TO GAP DOWN OPENING, A PULL BACK SEEMS TO ME VIABLE
| Description: |
|
| Filesize: |
11.34 KB |
| Viewed: |
881 Time(s) |
|
| Description: |
|
| Filesize: |
14.01 KB |
| Viewed: |
180 Time(s) |
|
|
|
| Back to top |
|
 |
ali522003
White Belt

Joined: 03 Jul 2010
Posts: 217
|
Post: #1176  Posted: Sun Jan 09, 2011 11:23 pm Post subject: Posted: Sun Jan 09, 2011 11:23 pm Post subject: |
 |
|
casper bhai,, deperately waiting for yoour tomorrow's calls..
All the best and gud nyt.. See you tomorrow with lots of accuracy ... Bye bye
|
|
| Back to top |
|
 |
casper
Green Belt

Joined: 02 Oct 2010
Posts: 1315
|
Post: #1177  Posted: Mon Jan 10, 2011 7:54 am Post subject: Posted: Mon Jan 10, 2011 7:54 am Post subject: |
 |
|
| ali522003 wrote: | casper bhai,, deperately waiting for yoour tomorrow's calls..
All the best and gud nyt.. See you tomorrow with lots of accuracy ... Bye bye |
hii ali bhai
todays market will be confusing for me, it has broken some of the important levels on friday and at the same time, i see positive divergence in many stocks.
going down will be tough and going up also not very easy
but "Khuda meherban to gadha pahelwan" 
God's willing, lets hope for best, 
|
|
| Back to top |
|
 |
casper
Green Belt

Joined: 02 Oct 2010
Posts: 1315
|
Post: #1178  Posted: Mon Jan 10, 2011 8:28 am Post subject: Posted: Mon Jan 10, 2011 8:28 am Post subject: |
 |
|
some stock, which can be considered for todays trading
1.IDFC: i already posted its details in reply to VISHAL.(mr.vishal_g)
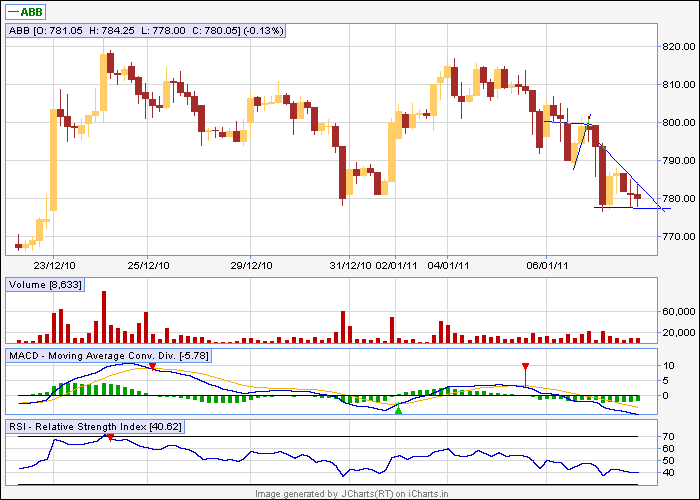
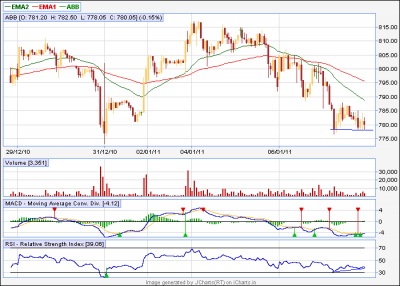
2.ABB: a DT in 60 min tf, but we have + div in smaller tf. i expect it to go up. we can sell it only with break down
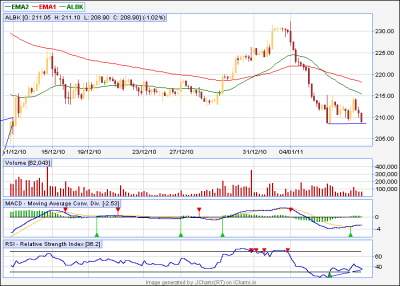
3.ALBK: looks like nvk. i am not confirm, but will try to buy it if it goes up. sl should be a few rupees below the double bottom
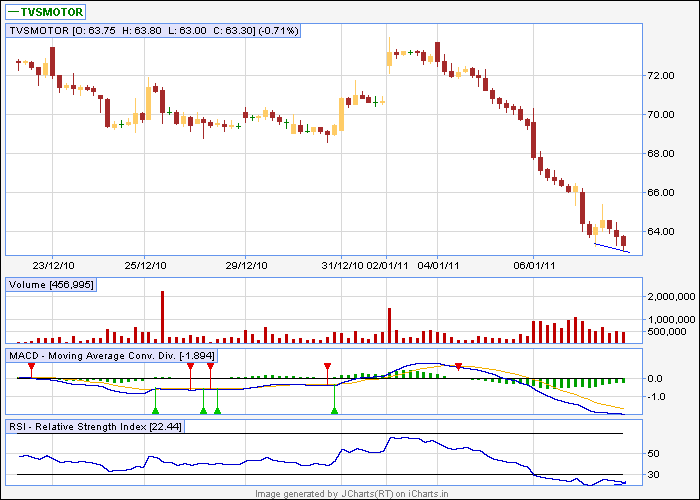
4.TVSMOTOR: price is almost on the monthly support. and we have + div. it can go up to 65 before going down again
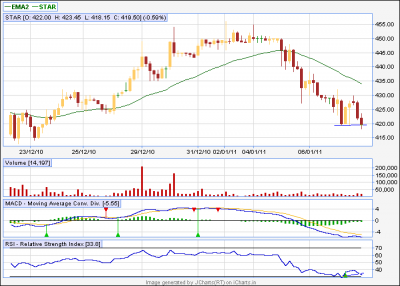
5.STAR: looks like nvk case again. cmp is 419. i expect it to go up to 430 atleast
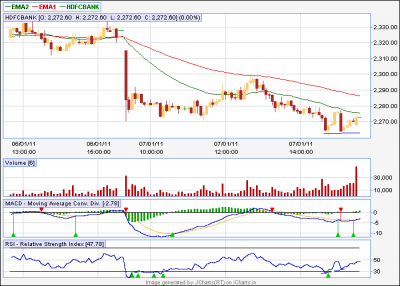
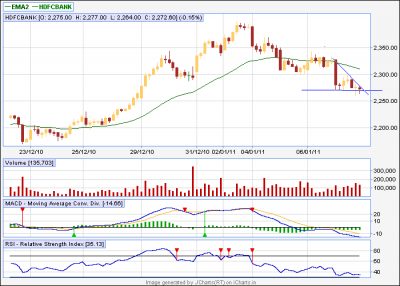
6.HDFCBANK: dt in 60 min but + div in smaller tf, we will sell only if it breaks down from 2260 level
| Description: |
|
| Filesize: |
11.48 KB |
| Viewed: |
843 Time(s) |
|
| Description: |
|
| Filesize: |
10.77 KB |
| Viewed: |
843 Time(s) |
|
| Description: |
|
| Filesize: |
12.7 KB |
| Viewed: |
169 Time(s) |
|
| Description: |
|
| Filesize: |
12.2 KB |
| Viewed: |
159 Time(s) |
|
| Description: |
|
| Filesize: |
13.98 KB |
| Viewed: |
174 Time(s) |
|
| Description: |
|
| Filesize: |
12.15 KB |
| Viewed: |
164 Time(s) |
|
| Description: |
|
| Filesize: |
13.52 KB |
| Viewed: |
172 Time(s) |
|
|
|
| Back to top |
|
 |
Allwell
White Belt

Joined: 24 Jan 2010
Posts: 183
|
Post: #1179  Posted: Mon Jan 10, 2011 9:09 am Post subject: Posted: Mon Jan 10, 2011 9:09 am Post subject: |
 |
|
Thanks Casper,
again for ur detailed reply
|
|
| Back to top |
|
 |
ali522003
White Belt

Joined: 03 Jul 2010
Posts: 217
|
Post: #1180  Posted: Mon Jan 10, 2011 9:18 am Post subject: Posted: Mon Jan 10, 2011 9:18 am Post subject: |
 |
|
CASPER BHAI PLEASE POST THE VALUES DEAR.. I M INTRESTED IN IDFC, ALBK, TVS MOTOR
| casper wrote: | some stock, which can be considered for todays trading
1.IDFC: i already posted its details in reply to VISHAL.(mr.vishal_g)
2.ABB: a DT in 60 min tf, but we have + div in smaller tf. i expect it to go up. we can sell it only with break down
3.ALBK: looks like nvk. i am not confirm, but will try to buy it if it goes up. sl should be a few rupees below the double bottom
4.TVSMOTOR: price is almost on the monthly support. and we have + div. it can go up to 65 before going down again
5.STAR: looks like nvk case again. cmp is 419. i expect it to go up to 430 atleast
6.HDFCBANK: dt in 60 min but + div in smaller tf, we will sell only if it breaks down from 2260 level |
|
|
| Back to top |
|
 |
casper
Green Belt

Joined: 02 Oct 2010
Posts: 1315
|
Post: #1181  Posted: Mon Jan 10, 2011 9:34 am Post subject: Posted: Mon Jan 10, 2011 9:34 am Post subject: |
 |
|
hi all specially ali bhai
what i planned is not happening in the market
we had a 75 pts down move in nifty
we could sell hdfcbank/abb and some other stocks
but personally i did not. i expected some pull back and i see nifty is pulling back
it was 75 pts down, now it is 41 pts down, already pulled back 30 pts,
this kind of high volatility in injurious to health  
so i am waiting to enter the trade, i hope by the hourly candle close i will be able to start trading. im still waiting here
once i find out something which i could trade, i will start posting all of its concerned levels, right now, i am just waiting in the side line
|
|
| Back to top |
|
 |
ali522003
White Belt

Joined: 03 Jul 2010
Posts: 217
|
Post: #1182  Posted: Mon Jan 10, 2011 9:42 am Post subject: Posted: Mon Jan 10, 2011 9:42 am Post subject: |
 |
|
I'LL ALSO PREFER TO WAIT THEN,, whereas your idfc is reslly looking good to me. albk had broken the double bottom.
so confused.
do notify if you trade something
| casper wrote: | hi all specially ali bhai
what i planned is not happening in the market
we had a 75 pts down move in nifty
we could sell hdfcbank/abb and some other stocks
but personally i did not. i expected some pull back and i see nifty is pulling back
it was 75 pts down, now it is 41 pts down, already pulled back 30 pts,
this kind of high volatility in injurious to health  
so i am waiting to enter the trade, i hope by the hourly candle close i will be able to start trading. im still waiting here
once i find out something which i could trade, i will start posting all of its concerned levels, right now, i am just waiting in the side line |
|
|
| Back to top |
|
 |
casper
Green Belt

Joined: 02 Oct 2010
Posts: 1315
|
Post: #1183  Posted: Mon Jan 10, 2011 9:53 am Post subject: Posted: Mon Jan 10, 2011 9:53 am Post subject: |
 |
|
i am watching IDFC and STAR
both are pulling back
idfc needs a grren candle above 168 level and star needs to close above its open=high price 420(420!!!!!)
then only we can buy
|
|
| Back to top |
|
 |
ali522003
White Belt

Joined: 03 Jul 2010
Posts: 217
|
Post: #1184  Posted: Mon Jan 10, 2011 9:56 am Post subject: Posted: Mon Jan 10, 2011 9:56 am Post subject: |
 |
|
Idfc buy karo to bolna bhai .. will go for it. i dont hav charts so cant see the candles.
| casper wrote: | i am watching IDFC and STAR
both are pulling back
idfc needs a grren candle above 168 level and star needs to close above its open=high price 420(420!!!!!)
then only we can buy |
|
|
| Back to top |
|
 |
casper
Green Belt

Joined: 02 Oct 2010
Posts: 1315
|
Post: #1185  Posted: Mon Jan 10, 2011 9:57 am Post subject: Posted: Mon Jan 10, 2011 9:57 am Post subject: |
 |
|
i will update u ali bhai, dont worry 
|
|
| Back to top |
|
 |
|
|
You cannot post new topics in this forum
You cannot reply to topics in this forum
You cannot edit your posts in this forum
You cannot delete your posts in this forum
You cannot vote in polls in this forum
You can attach files in this forum
You can download files in this forum
|
Powered by phpBB © 2001, 2005 phpBB Group
|
|
|

