| View previous topic :: View next topic |
| Author |
a layman's approach to break out and break down |
casper
Green Belt

Joined: 02 Oct 2010
Posts: 1315
|
Post: #1246  Posted: Mon Jan 10, 2011 3:13 pm Post subject: Posted: Mon Jan 10, 2011 3:13 pm Post subject: |
 |
|
u know my broker is also sbi
they are cursing us for sure, getting profit from us is their job, but now we are covering our loss from sbi only   
|
|
| Back to top |
|
 |
|
|
 |
ali522003
White Belt

Joined: 03 Jul 2010
Posts: 217
|
Post: #1247  Posted: Mon Jan 10, 2011 3:18 pm Post subject: Posted: Mon Jan 10, 2011 3:18 pm Post subject: |
 |
|
look at sbi as well as mrkt.. whatta fall.. all supports broken casper bhai ...
| casper wrote: | u know my broker is also sbi
they are cursing us for sure, getting profit from us is their job, but now we are covering our loss from sbi only    |
|
|
| Back to top |
|
 |
Ravi_S
Yellow Belt

Joined: 15 Jun 2009
Posts: 569
|
Post: #1248  Posted: Mon Jan 10, 2011 3:22 pm Post subject: Posted: Mon Jan 10, 2011 3:22 pm Post subject: |
 |
|
What a triangle breakdown... he he he 50 points easily achieved... 
| Ravi_S wrote: | SBIN is taking support in the triangle... Wait for a triangle breakout... Sell below 2600, for a 50 Rs target... What say guys?  |
|
|
| Back to top |
|
 |
casper
Green Belt

Joined: 02 Oct 2010
Posts: 1315
|
Post: #1249  Posted: Mon Jan 10, 2011 3:23 pm Post subject: Posted: Mon Jan 10, 2011 3:23 pm Post subject: |
 |
|
sbin is now 2537
u know ali bhai, vishy just called me (vishytns)
we were discussing about the levels
it looks like bnf will go down even more causing banks to fall more
|
|
| Back to top |
|
 |
casper
Green Belt

Joined: 02 Oct 2010
Posts: 1315
|
Post: #1250  Posted: Mon Jan 10, 2011 3:24 pm Post subject: Posted: Mon Jan 10, 2011 3:24 pm Post subject: |
 |
|
| Ravi_S wrote: | What a triangle breakdown... he he he 50 points easily achieved... 
| Ravi_S wrote: | SBIN is taking support in the triangle... Wait for a triangle breakout... Sell below 2600, for a 50 Rs target... What say guys?  |
|
yes ravi sir
my only sorrow is i was in intra position so my broker kicked me out at 3 pm sharp
  
|
|
| Back to top |
|
 |
singh.ravee
Yellow Belt

Joined: 12 Aug 2010
Posts: 678
|
Post: #1251  Posted: Mon Jan 10, 2011 5:23 pm Post subject: Posted: Mon Jan 10, 2011 5:23 pm Post subject: |
 |
|
| sherbaaz wrote: |
Hi,
When scrip/market is trending so strongly on one side no div would work.
trade in the direction of the trend in such strong trends u would get ample of opportunities why look for contra than.
regards, |
Sherbaaz bhai,
Does it mean that divergences work best in non-trending markets.
Thanks and Rgds
Ravee
|
|
| Back to top |
|
 |
newinvestor
White Belt

Joined: 16 Feb 2010
Posts: 120
|
Post: #1252  Posted: Mon Jan 10, 2011 6:46 pm Post subject: Posted: Mon Jan 10, 2011 6:46 pm Post subject: |
 |
|
| Casper, did you use 60 mins TF on a day like today also or did you come to a lower TF for your SBIN etc?
|
|
| Back to top |
|
 |
casper
Green Belt

Joined: 02 Oct 2010
Posts: 1315
|
Post: #1253  Posted: Mon Jan 10, 2011 7:03 pm Post subject: Posted: Mon Jan 10, 2011 7:03 pm Post subject: |
 |
|
| no, i used 60 min today also
|
|
| Back to top |
|
 |
Rahulsharmaat
Black Belt

Joined: 04 Nov 2009
Posts: 2766
|
Post: #1254  Posted: Mon Jan 10, 2011 8:10 pm Post subject: Posted: Mon Jan 10, 2011 8:10 pm Post subject: |
 |
|
what is TF can u explain pls
Casper can u explain me how to use Ichart levels for long or short--Please
|
|
| Back to top |
|
 |
casper
Green Belt

Joined: 02 Oct 2010
Posts: 1315
|
Post: #1255  Posted: Mon Jan 10, 2011 8:32 pm Post subject: Posted: Mon Jan 10, 2011 8:32 pm Post subject: |
 |
|
| Rahulsharmaat wrote: | what is TF can u explain pls
Casper can u explain me how to use Ichart levels for long or short--Please |
hii rahul
Tf means time frame, the frequency of candle updating
like when u see a DAILY chart, here the time frame is DAILY means candle updates daily here and each of the candle represents a total days transaction
this way a chart can hve various TF ranging from as high as MONTHLY to as low as 30 second TF
any chart which shows us the break up of transaction below 1 day and gets updated simultaneously with the market movement, is called REAL TIME CHART (RT CHART)
RT can be of 60min/30/min/20/15/10/5 min and so on
we use 60min real time chart to enter a trade. it takes 1 hour to complete a candle updating so we call it hourly chart also
our ST sir has wrote about these levels at length in his thread, he covered each and every aspect of intra day trading with the help of ICHART levels so minutely that trying to add something about ichart level will be a lunacy from my side
he covered from JULY to OCTOBER continuously. i am posting the link of his thread here. its of July, start reading from here and go through them up to OCTOBER
i bet nothing can make u a better intra day trader than this thread. u know it changed me from a looser guy to a more or less okey trader
if u follow his method closely then i am sure u will notice a lot of change in urself,
plz try it
http://www.icharts.in/forum/examples-t2516,postorder,desc,start,120.html
|
|
| Back to top |
|
 |
newinvestor
White Belt

Joined: 16 Feb 2010
Posts: 120
|
Post: #1256  Posted: Mon Jan 10, 2011 10:55 pm Post subject: Posted: Mon Jan 10, 2011 10:55 pm Post subject: |
 |
|
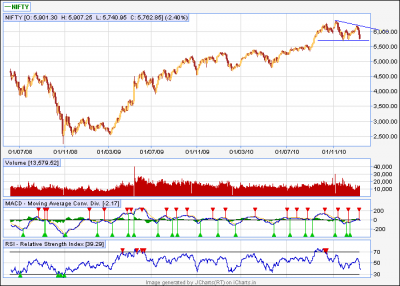
Casper, just your thoughts on Nifty.
Seems to be making a DT , with the bottom horizontal trendline at around 5700, and the top of the triangle around 6300.
MACD is bearish and so is RSI.
If it breaks below the trendline of around 5700, then target should be around 5100? ( the height of the DT?)
|
|
| Back to top |
|
 |
casper
Green Belt

Joined: 02 Oct 2010
Posts: 1315
|
Post: #1257  Posted: Mon Jan 10, 2011 11:15 pm Post subject: Posted: Mon Jan 10, 2011 11:15 pm Post subject: |
 |
|
as the DT is in formation so tomorrow if it breaks down the previous low then i dont think that BD will have full impact of that DT
to qualify as a dt proper, we need nifty to consolidate between the upper tl and lower tl for quite a long time
then only we will have a proper dt
now we have another problem. Portugal is going to be the next euro crisis maker and it painted euro zone red already
dow made a low of 70 pts during early hours and now trading at minus 48 pts
so tomorrow we have some real chance to go down and make new low
in that case i dont think this DT will be effective as its under formation
but if it is saved again and bounce back from recent low and make lower high in near future, then we can say that our DT is intact and gathering strength
plz before trading, try to check where is dow, u can just google it or i will update
if dow recovers then okey or else we can have a major gap down also.
in the attached chart, see this DT is under formation only. a few lower high and equal low is needed to give it proper shape
| Description: |
|
| Filesize: |
16.7 KB |
| Viewed: |
178 Time(s) |

|
|
|
| Back to top |
|
 |
RoyalTrader
White Belt

Joined: 31 Oct 2010
Posts: 75
|
Post: #1258  Posted: Mon Jan 10, 2011 11:29 pm Post subject: Posted: Mon Jan 10, 2011 11:29 pm Post subject: |
 |
|
Hi casper,
Just one observation..
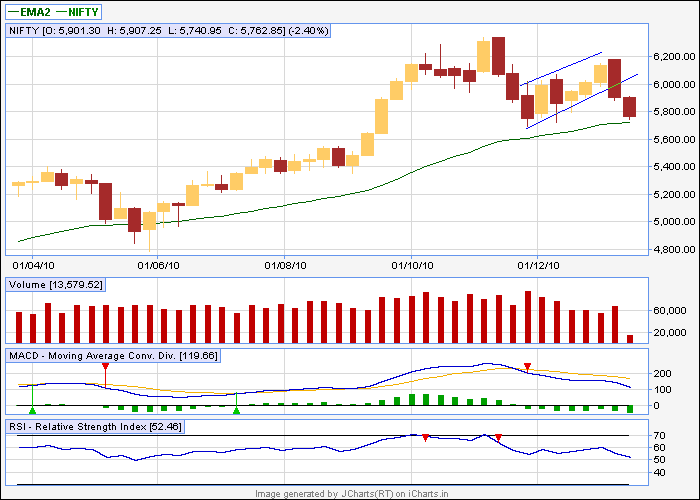
If you check weekly chart of nifty spot there is a bear flag.. A break down has already happened today below 5900.. A potential break down will happen below imp support of 5690.. A healthy fall will come if nifty spot closes below 5690 on weekly basis.. Target for this bear flag is 5300...
Regards,
RT
|
|
| Back to top |
|
 |
technocalls
White Belt

Joined: 27 Aug 2010
Posts: 34
|
Post: #1259  Posted: Tue Jan 11, 2011 12:06 am Post subject: Posted: Tue Jan 11, 2011 12:06 am Post subject: |
 |
|
| i thing 5690 is one of the imp support for nifty. this last rally starts from 5690. nifty made low of 5690.75 on 24/11/10. this point could be 100% retracemnet of the rally.below 5690 nifty may take support of 200 dma arnd 5637. below that the next trg would be 5400.
|
|
| Back to top |
|
 |
casper
Green Belt

Joined: 02 Oct 2010
Posts: 1315
|
Post: #1260  Posted: Tue Jan 11, 2011 8:22 am Post subject: Posted: Tue Jan 11, 2011 8:22 am Post subject: |
 |
|
| RoyalTrader wrote: | Hi casper,
Just one observation..
If you check weekly chart of nifty spot there is a bear flag.. A break down has already happened today below 5900.. A potential break down will happen below imp support of 5690.. A healthy fall will come if nifty spot closes below 5690 on weekly basis.. Target for this bear flag is 5300...
Regards,
RT |
hii RT
thanks for the input, i have not checked weekly chart earlier
yes it looks like a flag of mr bear, weekly 34 ema is here, it is a great sup/resi level for weekly chart, now if it resist it then okey but looks like wont resist this time
flags are generally known for far more reliable than any other patterns
| Description: |
|
| Filesize: |
10.32 KB |
| Viewed: |
608 Time(s) |

|
|
|
| Back to top |
|
 |
|

