|
|
| View previous topic :: View next topic |
| Author |
a layman's approach to break out and break down |
girishhu1
White Belt

Joined: 17 Aug 2009
Posts: 316
|
Post: #136  Posted: Sun Nov 07, 2010 8:55 am Post subject: Posted: Sun Nov 07, 2010 8:55 am Post subject: |
 |
|
hellow casperji,
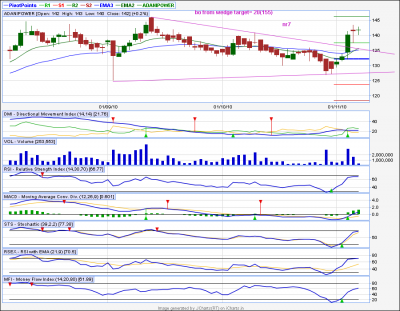
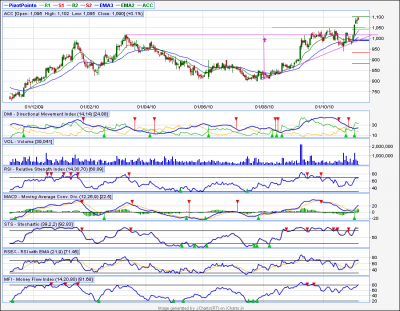
similar is the case for acc, adani power. kindly give a strategy for mondays trade.
regards 
| Description: |
|
| Filesize: |
56.68 KB |
| Viewed: |
359 Time(s) |
|
| Description: |
|
| Filesize: |
64.12 KB |
| Viewed: |
368 Time(s) |
|
|
|
| Back to top |
|
 |
|
|  |
casper
Green Belt

Joined: 02 Oct 2010
Posts: 1315
|
Post: #137  Posted: Sun Nov 07, 2010 9:13 am Post subject: Posted: Sun Nov 07, 2010 9:13 am Post subject: |
 |
|
hi girishhu1,
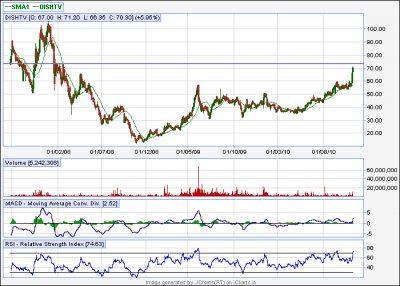
yes its a bo and moving up nicely. but we have a resistance at 75 level, so for positional trade, we may wait to break this reistance as after breaking this tl, we will have a free space up to 90, or we may buy in installments, may be in 3 or 4 parts while keeping in mind that we need to take out this level in order to make upward.
for intraday trading, if it opens with a gap up and the start declining, we may sell it at higher level or in case of a normal opening, we may buy, all the way, we have to be careful of 75, and need to watch the price behaviour at this level and take steps accordingly
(got ur posting abt acc/adanipower, posting my reply abt them in a while,plz wait)
| Description: |
|
| Filesize: |
17.02 KB |
| Viewed: |
364 Time(s) |
|
|
|
| Back to top |
|
 |
casper
Green Belt

Joined: 02 Oct 2010
Posts: 1315
|
Post: #138  Posted: Sun Nov 07, 2010 9:27 am Post subject: Posted: Sun Nov 07, 2010 9:27 am Post subject: |
 |
|
acc
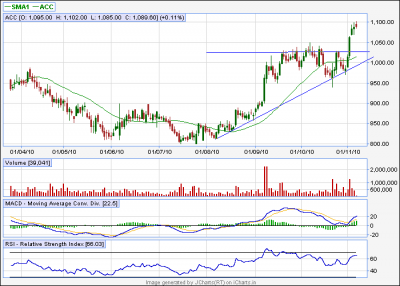
its an ascending triangle, the picture should be a lil different, i have posted this, now we have a target of 1150, above that we will have our saucer formation complete, so above 1150 we can expect huge upmove,
the trading strategy should be same as dishtv, we can go for installment purchase for positional trading,and in case of intraday, we have to see where it opens and take steps accordingly
ps : i have not posted the saucer formation here, only triangle is posted, i will post the full saucer formation once it takes out 1150
| Description: |
|
| Filesize: |
14.16 KB |
| Viewed: |
363 Time(s) |
|
|
|
| Back to top |
|
 |
casper
Green Belt

Joined: 02 Oct 2010
Posts: 1315
|
Post: #139  Posted: Sun Nov 07, 2010 9:34 am Post subject: Posted: Sun Nov 07, 2010 9:34 am Post subject: |
 |
|
hi girish, im sorry , ur posting in acc is perfect, i have messed acc with adani while opening in my j chart and so i wrote that acc picture wil b diff. but u r right, ur chart is same as my chart and both r correct
sorry for confussion
|
|
| Back to top |
|
 |
casper
Green Belt

Joined: 02 Oct 2010
Posts: 1315
|
Post: #140  Posted: Sun Nov 07, 2010 9:42 am Post subject: Posted: Sun Nov 07, 2010 9:42 am Post subject: |
 |
|
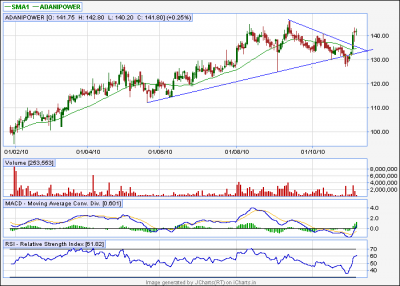
adani power
what u posted is an descending triangle, which is a bearish pattern so it can not explian an upmove,so i have changed the picture to make it a symmetrical trangle , now we have a target of 145,150 while support at 135-140 level
| Description: |
|
| Filesize: |
14.32 KB |
| Viewed: |
383 Time(s) |
|
|
|
| Back to top |
|
 |
girishhu1
White Belt

Joined: 17 Aug 2009
Posts: 316
|
Post: #141  Posted: Sun Nov 07, 2010 10:05 am Post subject: Posted: Sun Nov 07, 2010 10:05 am Post subject: |
 |
|
casperji,
thanks a lot for immediate reply.doubts are like hanging sword on head. you feel relaxed when they are cleared.
thanks again on behalf of all newbies.
regards,
girish
|
|
| Back to top |
|
 |
newinvestor
White Belt

Joined: 16 Feb 2010
Posts: 120
|
Post: #142  Posted: Sun Nov 07, 2010 10:06 am Post subject: Posted: Sun Nov 07, 2010 10:06 am Post subject: |
 |
|
Casper, what do you think of apollo tyres? Do you see a H&S forming over the past couple of weeks?
thanks for the post on H&S. Will study.
what are your picks for Monday?
|
|
| Back to top |
|
 |
casper
Green Belt

Joined: 02 Oct 2010
Posts: 1315
|
|
| Back to top |
|
 |
vishytns
White Belt

Joined: 26 Nov 2009
Posts: 206
|
Post: #144  Posted: Sun Nov 07, 2010 10:35 am Post subject: Posted: Sun Nov 07, 2010 10:35 am Post subject: |
 |
|
Casper,
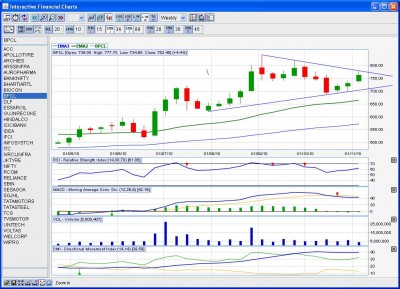
Symmetrical Triangle formation in weekly charts of BPCL. I request your analysis and views.
Thanks in advance for your analysis and education on various price patterns.
Vishwanath
| Description: |
|
| Filesize: |
145.98 KB |
| Viewed: |
351 Time(s) |
|
|
|
| Back to top |
|
 |
newinvestor
White Belt

Joined: 16 Feb 2010
Posts: 120
|
Post: #145  Posted: Sun Nov 07, 2010 10:36 am Post subject: Posted: Sun Nov 07, 2010 10:36 am Post subject: |
 |
|
Thanks, and all the best for your rituals.
i am holding Apollo tyres, looks like I should get out quickly on Monday.
Also, Voltas dipped on Friday . The Volumes above 250 have not been encouraging. Looks like best to exit voltas also?
|
|
| Back to top |
|
 |
svkum
White Belt

Joined: 14 Feb 2007
Posts: 321
|
Post: #146  Posted: Sun Nov 07, 2010 11:35 am Post subject: Posted: Sun Nov 07, 2010 11:35 am Post subject: |
 |
|
any breakout wd be effective provided its followed consistently .
It may be on
1)breaking trendline
2)breaking certain periods HH,LL
3) breaking above certain emas , or crossover of emas anything
so be consistent and watchfull
screener shd help in locating such scrips and events.
s v kumthekar
|
|
| Back to top |
|
 |
casper
Green Belt

Joined: 02 Oct 2010
Posts: 1315
|
Post: #147  Posted: Sun Nov 07, 2010 11:48 am Post subject: Posted: Sun Nov 07, 2010 11:48 am Post subject: |
 |
|
hi viswanath,
nice finding, as we know symmetrical triangle is a neutral pattern, so theoretically, a break out or break down anything may happen, the direction of price move will depend on the bo,
now the widest part of the triangle is about 140, (840top-700 bottom) so the possible price target would be rupees 140 from the bo point
ps: u can find a "EXPORT CHART AS PNG" tab just above the charting area of the same page where the chart is situated, it will save the chart in ur computer, u can save it this way so that u dont need to take screen shots 
|
|
| Back to top |
|
 |
casper
Green Belt

Joined: 02 Oct 2010
Posts: 1315
|
Post: #148  Posted: Sun Nov 07, 2010 11:57 am Post subject: Posted: Sun Nov 07, 2010 11:57 am Post subject: |
 |
|
hi newinvestor, thanks for ur wishes,
as far as voltas is concerned, it has faced resistance at 257-260 level and gone down, vol is low due to mahurat trading as the time was lesser,
plz watch out monday if it takes support of 250 and head back,even if it may consolidate a lil around 250.
u can hold it if it consolidate here, because there will be a chance of bounce back from this level
or u may exit here and re enter the stock if it clears 260 +filter, in that case, u will loose 5-10 rupees but the tension will be much lesser as there is no significant resistance above 260
svkum sir, thanks for ur suggestion
|
|
| Back to top |
|
 |
vishytns
White Belt

Joined: 26 Nov 2009
Posts: 206
|
Post: #149  Posted: Sun Nov 07, 2010 12:11 pm Post subject: Posted: Sun Nov 07, 2010 12:11 pm Post subject: |
 |
|
Casper,
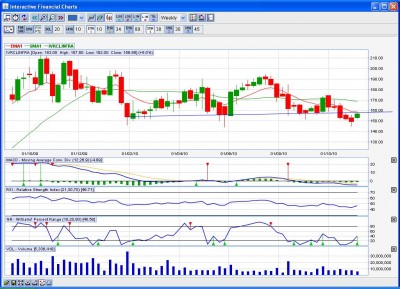
I have tried using "Export as PNG" to generate the chart. It generates a .php file and when I preview the post I will not see any image. So i have to take a screen shot and generate .jpg file. Once again I have taken a screen shot of IVRCL Infra (weely charts). I see that It looks like head and shoulders, could you please post your views on this also.
Thanks.
| Description: |
|
| Filesize: |
150.35 KB |
| Viewed: |
370 Time(s) |
|
|
|
| Back to top |
|
 |
casper
Green Belt

Joined: 02 Oct 2010
Posts: 1315
|
Post: #150  Posted: Sun Nov 07, 2010 12:35 pm Post subject: Posted: Sun Nov 07, 2010 12:35 pm Post subject: |
 |
|
i hv gone through this chart and in past i hv seen many of ur postings, ur findings are always superb 
yes, its an exact head and shoulder. the price has moved to bo level and as per our theory, it will start going down to 130 level, the only concern is less vol, let us hope some increment in the vol here
|
|
| Back to top |
|
 |
|
|
You cannot post new topics in this forum
You cannot reply to topics in this forum
You cannot edit your posts in this forum
You cannot delete your posts in this forum
You cannot vote in polls in this forum
You can attach files in this forum
You can download files in this forum
|
Powered by phpBB © 2001, 2005 phpBB Group
|
|
|

