| View previous topic :: View next topic |
| Author |
a layman's approach to break out and break down |
sumesh_sol
Brown Belt

Joined: 06 Jun 2010
Posts: 2344
|
Post: #1351  Posted: Wed Jan 12, 2011 10:49 am Post subject: Posted: Wed Jan 12, 2011 10:49 am Post subject: |
 |
|
| sumesh_sol wrote: | | casper wrote: | waiting for 5 minutes
to close the current candle
will have to face HUGE loss now |
Hi Casper,
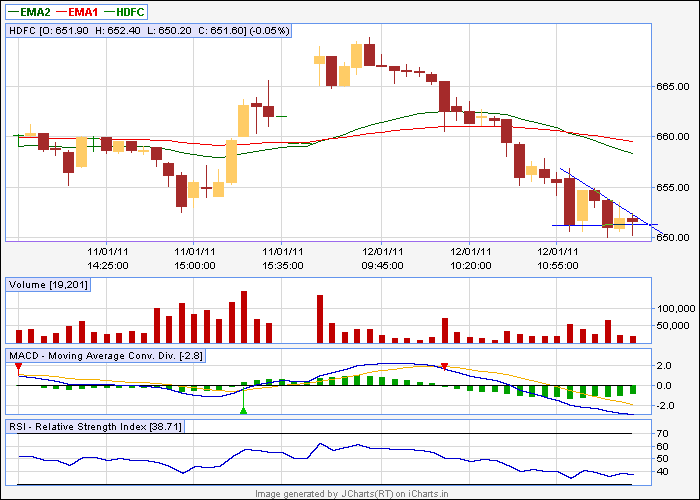
HDFC is moving in this channel (on 60 tf).. I'm just trying to give another perspective, please use your judgement... |
Don't you think it is making Flag pattern and you should reverse your position upon breaking the flag.. ?
|
|
| Back to top |
|
 |
|
|
|
sherbaaz
Yellow Belt

Joined: 27 May 2009
Posts: 543
|
| Post: #1352 Posted: Wed Jan 12, 2011 10:49 am Post subject: |
|
|
| sumesh_sol wrote: | | casper wrote: | waiting for 5 minutes
to close the current candle
will have to face HUGE loss now |
Hi Casper,
HDFC is moving in this channel (on 60 tf).. I'm just trying to give another perspective, please use your judgement... |
Hi,
this is bear flag break down below the lower TL would start further down slide keeping the depth of the bear flag as tgt from breakout point.
Regards,
|
|
| Back to top |
|
|
Ravi_S
Yellow Belt
Joined: 15 Jun 2009
Posts: 569
|
| Post: #1353 Posted: Wed Jan 12, 2011 10:51 am Post subject: |
|
|
Sherbaaz... Bingo... Better to exit on the break of the bottom trendline... Looks like a FLAG breakdown...
Regards
Ravi
| sherbaaz wrote: | | sumesh_sol wrote: | | casper wrote: | waiting for 5 minutes
to close the current candle
will have to face HUGE loss now |
Hi Casper,
HDFC is moving in this channel (on 60 tf).. I'm just trying to give another perspective, please use your judgement... |
Hi,
this is bear flag break down below the lower TL would start further down slide keeping the depth of the bear flag as tgt from breakout point.
Regards, |
|
|
| Back to top |
|
|
casper
Green Belt

Joined: 02 Oct 2010
Posts: 1315
|
| Post: #1354 Posted: Wed Jan 12, 2011 10:51 am Post subject: |
|
|
| sumesh_sol wrote: | | sumesh_sol wrote: | | casper wrote: | waiting for 5 minutes
to close the current candle
will have to face HUGE loss now |
Hi Casper,
HDFC is moving in this channel (on 60 tf).. I'm just trying to give another perspective, please use your judgement... |
Don't you think it is making Flag pattern and you should reverse your position upon breaking the flag.. ? |
yes sumesh bhai
sorry was busy in a call so could not see ur msg, now if it breakes i will sell
u r right
|
|
| Back to top |
|
|
sumesh_sol
Brown Belt
Joined: 06 Jun 2010
Posts: 2344
|
| Post: #1355 Posted: Wed Jan 12, 2011 11:24 am Post subject: |
|
|
| casper wrote: | | sumesh_sol wrote: | | sumesh_sol wrote: | | casper wrote: | waiting for 5 minutes
to close the current candle
will have to face HUGE loss now |
Hi Casper,
HDFC is moving in this channel (on 60 tf).. I'm just trying to give another perspective, please use your judgement... |
Don't you think it is making Flag pattern and you should reverse your position upon breaking the flag.. ? |
yes sumesh bhai
sorry was busy in a call so could not see ur msg, now if it breakes i will sell
u r right |
642 & 633 are weekly & monthly supports.. Just for your info.. I'm sure u might have already seen that.. Good levels to book shorts(if u have reversed and now in short position)... 633 is also 200 sma on eod...
|
|
| Back to top |
|
|
casper
Green Belt
Joined: 02 Oct 2010
Posts: 1315
|
| Post: #1356 Posted: Wed Jan 12, 2011 11:28 am Post subject: |
|
|
yes sumesh bhai, i have seen it
i see a dt in 5 min tf where 650 is supporting so will sell at break down at 650 and will try to book 645
| Description: |
|
| Filesize: |
10.92 KB |
| Viewed: |
782 Time(s) |
|
|
|
| Back to top |
|
|
sumesh_sol
Brown Belt
Joined: 06 Jun 2010
Posts: 2344
|
| Post: #1357 Posted: Wed Jan 12, 2011 12:06 pm Post subject: TATAMTRDVR |
|
|
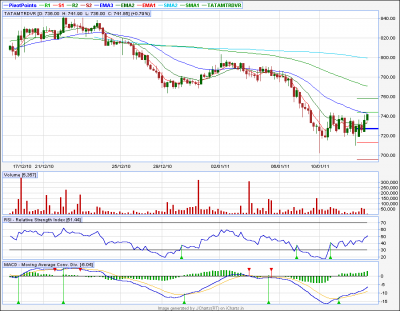
TATAMTRDVR
************
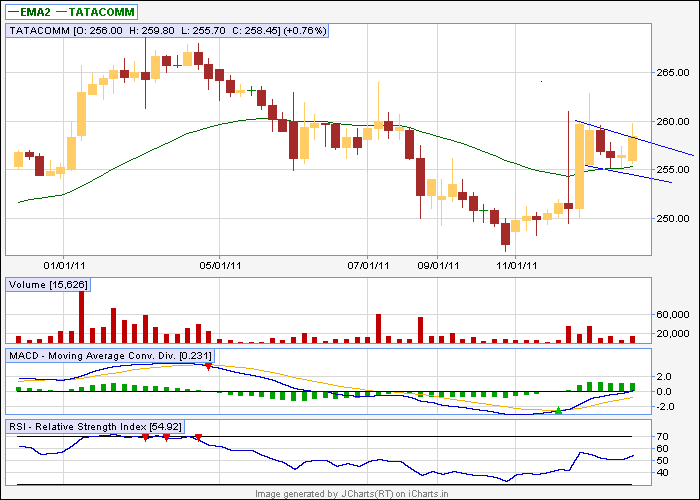
has been moving in tight range .. looks strong.. 750-755 is weekly pivot.. Above that.. it can fly...
| Description: |
|
| Filesize: |
21.97 KB |
| Viewed: |
155 Time(s) |
|
|
|
| Back to top |
|
|
casper
Green Belt
Joined: 02 Oct 2010
Posts: 1315
|
|
| Back to top |
|
|
ali522003
White Belt

Joined: 03 Jul 2010
Posts: 217
|
| Post: #1359 Posted: Wed Jan 12, 2011 2:52 pm Post subject: Re: TATAMTRDVR |
|
|
| sumesh_sol wrote: | TATAMTRDVR
************
has been moving in tight range .. looks strong.. 750-755 is weekly pivot.. Above that.. it can fly... |
nice call sumesh bhai
|
|
| Back to top |
|
|
chetan83
Brown Belt
Joined: 19 Feb 2010
Posts: 2036
|
| Post: #1360 Posted: Wed Jan 12, 2011 5:07 pm Post subject: |
|
|
Hi Sumesh/Casper,
Pls throw some light on Bank Nifty. Now today i was releaved to see ICICI at 1074, still hope whether it turn green. Pls share the levels for BnF.
|
|
| Back to top |
|
|
singh.ravee
Yellow Belt
Joined: 12 Aug 2010
Posts: 678
|
| Post: #1361 Posted: Wed Jan 12, 2011 7:20 pm Post subject: |
|
|
| chetan83 wrote: | Hi Sumesh/Casper,
Pls throw some light on Bank Nifty. Now today i was releaved to see ICICI at 1074, still hope whether it turn green. Pls share the levels for BnF. |
casper bhai,
with your kind anticipated permission, I m replying on banknifty. 
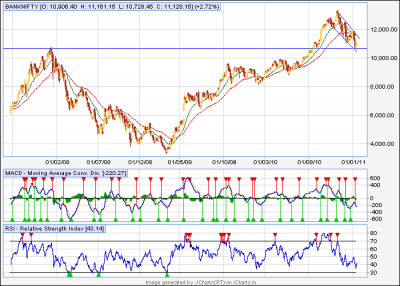
In eod charts, today's trade has confirmed bullish harami hence its a positive signal. Since banknifty bounced from support level, its another point favouring upmove.
cmp= 11128; some resistance is around 11140, i think we may outcome this.
11500-11600 zone is going to be a resistance zone. If passes this zone then 11900 is possible.
Had i been at ur place i would have covered my long positon around this zone on confirmed bearish candle on 60 min tf. If banknifty manages to pass this zone then reenter around 11650 for 11900.
I leave my observation for any further comments.
Thanks and Regards
ravee
|
|
| Back to top |
|
|
casper
Green Belt
Joined: 02 Oct 2010
Posts: 1315
|
|
| Back to top |
|
|
sherbaaz
Yellow Belt
Joined: 27 May 2009
Posts: 543
|
| Post: #1363 Posted: Wed Jan 12, 2011 9:34 pm Post subject: |
|
|
with your kind anticipated permission, I m replying on banknifty.
In eod charts, today's trade has confirmed bullish harami hence its a positive signal. Since banknifty bounced from support level, its another point favouring upmove.
Hi,
Harami is one of the weakest signals/patterns in candlesticks.
Regards,
|
|
| Back to top |
|
|
casper
Green Belt
Joined: 02 Oct 2010
Posts: 1315
|
| Post: #1364 Posted: Wed Jan 12, 2011 9:40 pm Post subject: |
|
|
| sherbaaz wrote: | with your kind anticipated permission, I m replying on banknifty.
In eod charts, today's trade has confirmed bullish harami hence its a positive signal. Since banknifty bounced from support level, its another point favouring upmove.
Hi,
Harami is one of the weakest signals/patterns in candlesticks.
Regards, |
yes really weakest but this time it paid off
|
|
| Back to top |
|
|
singh.ravee
Yellow Belt
Joined: 12 Aug 2010
Posts: 678
|
| Post: #1365 Posted: Wed Jan 12, 2011 11:15 pm Post subject: |
|
|
sherbaaz bhai,
thank u so much for ur comments. I really appreciate your simplicity and clarity on trading. Casper knows about it(hope u remem our sb conversation).
keep sharing with us all.
rgds
ravee
|
|
| Back to top |
|
|
|