| View previous topic :: View next topic |
| Author |
a layman's approach to break out and break down |
vishytns
White Belt

Joined: 26 Nov 2009
Posts: 206
|
Post: #1366  Posted: Thu Jan 13, 2011 7:52 am Post subject: Posted: Thu Jan 13, 2011 7:52 am Post subject: |
 |
|
Hi sherbaaz,
you have mentioned that harami is a weakest pattern, do you mean to say that bank nifty will not sustain the current upmove. Please elaborate.
Thanks
|
|
| Back to top |
|
 |
|
|
|
casper
Green Belt

Joined: 02 Oct 2010
Posts: 1315
|
| Post: #1367 Posted: Thu Jan 13, 2011 8:33 am Post subject: |
|
|
| singh.ravee wrote: | sherbaaz bhai,
thank u so much for ur comments. I really appreciate your simplicity and clarity on trading. Casper knows about it(hope u remem our sb conversation).
keep sharing with us all.
rgds
ravee |
yes ravee i remember
only thing i want is sherbaz bhai must come out with detail explanation of his method in a systematic manner, because i am sure if a trader like him shares his experience with us in details then all of us will be heavily benefited
|
|
| Back to top |
|
|
singh.ravee
Yellow Belt

Joined: 12 Aug 2010
Posts: 678
|
| Post: #1368 Posted: Thu Jan 13, 2011 10:05 am Post subject: |
|
|
casper hello,
in nifty and bank nifty, on 60min tf, is it evening star being rejected from 50 ema.
can we go short
thanks n rgds
ravee
|
|
| Back to top |
|
|
casper
Green Belt
Joined: 02 Oct 2010
Posts: 1315
|
| Post: #1369 Posted: Thu Jan 13, 2011 10:38 am Post subject: |
|
|
| singh.ravee wrote: | casper hello,
in nifty and bank nifty, on 60min tf, is it evening star being rejected from 50 ema.
can we go short
thanks n rgds
ravee |
in this volatile situation, things are changing very fast. so using 60 min tf for trade wont be easy until the trend is established
i am watching 5 min tf bcoz of smaller movements
as per 5 in tf, 89 ema sipported the price at 5806 and it bounced back so until 5806 is breached no question of shorting nifty
|
|
| Back to top |
|
|
sherbaaz
Yellow Belt
Joined: 27 May 2009
Posts: 543
|
| Post: #1370 Posted: Thu Jan 13, 2011 10:46 am Post subject: |
|
|
| vishytns wrote: | Hi sherbaaz,
you have mentioned that harami is a weakest pattern, do you mean to say that bank nifty will not sustain the current upmove. Please elaborate.
Thanks |
Hi,
if you see the overall chart of bank nf EOD you will find couple of interesting thing. now before finding interesting things you need to decide whether to go for contra trade or to be with the trend. I would prefer to be in the trend.
there is an evening star pattern on 4-01 which is a rejection from 34 ema also and also it became a swing pivot also as it formed new low. the slope of 34 ema is down ward which is again a problem for long trade as it would act as a resistance for sure in upside movement. you can taken any ema/sma dont get your self confused whether to use 20,50,34 etc you anything with which u r comfortable.
the scenario for me is bearish i would not for for any short or contra trade that to on the basis of a weak candle pattern like harami which has high odds of failure on stand alone basis. had there been a good divergence i would had taken the long keeping 34 ema as tgt and used the TSL.
now how trend would get changes if it close above the high if 4-01 candle or above 34 ema and the slope start moving upside.
for sure waiting this long required patience. but always have this in mind that stock market is all about ODDS and small trader like us are having all ODDS against us. so we have to work out how to make odds in our favor as much as possible.
I have not used any indicator in above explanation you can further enhance it by using the indicators which you are using.
regards,
|
|
| Back to top |
|
|
sherbaaz
Yellow Belt
Joined: 27 May 2009
Posts: 543
|
| Post: #1371 Posted: Thu Jan 13, 2011 10:51 am Post subject: |
|
|
| casper wrote: | | singh.ravee wrote: | sherbaaz bhai,
thank u so much for ur comments. I really appreciate your simplicity and clarity on trading. Casper knows about it(hope u remem our sb conversation).
keep sharing with us all.
rgds
ravee |
yes ravee i remember
only thing i want is sherbaz bhai must come out with detail explanation of his method in a systematic manner, because i am sure if a trader like him shares his experience with us in details then all of us will be heavily benefited |
Hi,
Thanks for the appreciation but I am as good as you all are. the only difference is i always try to keep things simple and easy in my trading.
now the detail explanation of my systems or wht i follow demands time to put. thats why wherever i get an opportunity like in your tread i put my inputs and more imp learn many new things.
hope to further share my little knowledge with all of you.
Regards,
PS: no body talks about money management????
|
|
| Back to top |
|
|
Ravi_S
Yellow Belt
Joined: 15 Jun 2009
Posts: 569
|
| Post: #1372 Posted: Thu Jan 13, 2011 11:12 am Post subject: |
|
|
Sherbaaz
It would be great if someone like you/Jimmie talk about Money management... That's one area where I'm totally gone... Any good reading materials suggested would also be of great help..
Regards
Ravi 
|
|
| Back to top |
|
|
Ravi_S
Yellow Belt
Joined: 15 Jun 2009
Posts: 569
|
| Post: #1373 Posted: Thu Jan 13, 2011 11:19 am Post subject: |
|
|
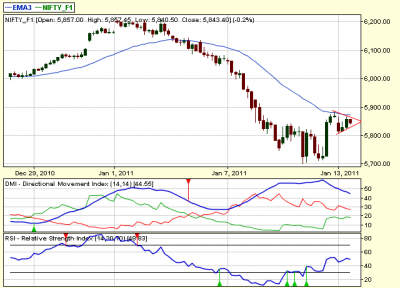
PENNANT formation in NF 60 mins chart... Lets see if the breakout is good enough...
Regards
Ravi
| Description: |
|
| Filesize: |
20.08 KB |
| Viewed: |
148 Time(s) |
|
|
|
| Back to top |
|
|
vishytns
White Belt
Joined: 26 Nov 2009
Posts: 206
|
| Post: #1374 Posted: Thu Jan 13, 2011 11:39 am Post subject: |
|
|
Sherbaaz,
Thanks for your time and detailed explanation
| sherbaaz wrote: | | vishytns wrote: | Hi sherbaaz,
you have mentioned that harami is a weakest pattern, do you mean to say that bank nifty will not sustain the current upmove. Please elaborate.
Thanks |
Hi,
if you see the overall chart of bank nf EOD you will find couple of interesting thing. now before finding interesting things you need to decide whether to go for contra trade or to be with the trend. I would prefer to be in the trend.
there is an evening star pattern on 4-01 which is a rejection from 34 ema also and also it became a swing pivot also as it formed new low. the slope of 34 ema is down ward which is again a problem for long trade as it would act as a resistance for sure in upside movement. you can taken any ema/sma dont get your self confused whether to use 20,50,34 etc you anything with which u r comfortable.
the scenario for me is bearish i would not for for any short or contra trade that to on the basis of a weak candle pattern like harami which has high odds of failure on stand alone basis. had there been a good divergence i would had taken the long keeping 34 ema as tgt and used the TSL.
now how trend would get changes if it close above the high if 4-01 candle or above 34 ema and the slope start moving upside.
for sure waiting this long required patience. but always have this in mind that stock market is all about ODDS and small trader like us are having all ODDS against us. so we have to work out how to make odds in our favor as much as possible.
I have not used any indicator in above explanation you can further enhance it by using the indicators which you are using.
regards, |
|
|
| Back to top |
|
|
Ravi_S
Yellow Belt
Joined: 15 Jun 2009
Posts: 569
|
| Post: #1375 Posted: Thu Jan 13, 2011 11:44 am Post subject: |
|
|
Break out has happened in 60 mins @ 5841... 1st target 34 ema hourly and then next target 5900... Lets see..
Regard
Ravi
| Ravi_S wrote: | PENNANT formation in NF 60 mins chart... Lets see if the breakout is good enough...
Regards
Ravi |
|
|
| Back to top |
|
|
casper
Green Belt
Joined: 02 Oct 2010
Posts: 1315
|
| Post: #1376 Posted: Thu Jan 13, 2011 11:55 am Post subject: |
|
|
nice call ravi sir, but it does not looks like a pennant
a pennant is a small symmetrical triangle , but here it looks like more of dt becoz lower tl is almost flat
plz comment
|
|
| Back to top |
|
|
Ravi_S
Yellow Belt
Joined: 15 Jun 2009
Posts: 569
|
|
| Back to top |
|
|
casper
Green Belt
Joined: 02 Oct 2010
Posts: 1315
|
| Post: #1378 Posted: Thu Jan 13, 2011 12:24 pm Post subject: |
|
|
ok not sir, u r my elder brther, thats alrigght? 
yes now it looks like pennant truly
but watch out monthly s1 level around 5854 or so, just below the 34 ema , it might take time to cross it
|
|
| Back to top |
|
|
Ravi_S
Yellow Belt
Joined: 15 Jun 2009
Posts: 569
|
| Post: #1379 Posted: Thu Jan 13, 2011 12:26 pm Post subject: |
|
|
TL broken at the bottom... I said I'm new... 
| casper wrote: | ok not sir, u r my elder brther, thats alrigght?
yes now it looks like pennant truly
but watch out monthly s1 level around 5854 or so, just below the 34 ema , it might take time to cross it |
|
|
| Back to top |
|
|
as4manju
White Belt
Joined: 22 Mar 2007
Posts: 390
|
| Post: #1380 Posted: Thu Jan 13, 2011 12:33 pm Post subject: |
|
|
Hi Casper,
It might sound silly or funny though its simple things i want to know about intra day charts as i ve never used it  even though i ve data on it as i ve always relied on EOD data. Its interesting to see people posting and discussing on the time frame and diffrent setups.. what is the role of money management in using this real time data and how do u trade the setups which are formed and closing hours of the mkt which is followed by a big gap up or a gap down and how effective it is to carry home postions based on the intrady charts the role of volatility say like what happened day before yesterday suddedn fall to 5700 and a quick recovery back to the days high in no time.. even though i ve data on it as i ve always relied on EOD data. Its interesting to see people posting and discussing on the time frame and diffrent setups.. what is the role of money management in using this real time data and how do u trade the setups which are formed and closing hours of the mkt which is followed by a big gap up or a gap down and how effective it is to carry home postions based on the intrady charts the role of volatility say like what happened day before yesterday suddedn fall to 5700 and a quick recovery back to the days high in no time..
Regards
Manju
| casper wrote: | nice call ravi sir, but it does not looks like a pennant
a pennant is a small symmetrical triangle , but here it looks like more of dt becoz lower tl is almost flat
plz comment |
|
|
| Back to top |
|
|
|