|
|
| View previous topic :: View next topic |
| Author |
a layman's approach to break out and break down |
casper
Green Belt

Joined: 02 Oct 2010
Posts: 1315
|
Post: #1381  Posted: Thu Jan 13, 2011 12:34 pm Post subject: Posted: Thu Jan 13, 2011 12:34 pm Post subject: |
 |
|
no problem. pennant or symmetrical triangle does not tells us about direction, it just says that some thing big will happen in any of the directions

|
|
| Back to top |
|
 |
|
| |
casper
Green Belt
Joined: 02 Oct 2010
Posts: 1315
|
| Post: #1382 Posted: Thu Jan 13, 2011 1:01 pm Post subject: |
|
|
| as4manju wrote: | Hi Casper,
It might sound silly or funny though its simple things i want to know about intra day charts as i ve never used it  even though i ve data on it as i ve always relied on EOD data. Its interesting to see people posting and discussing on the time frame and diffrent setups.. what is the role of money management in using this real time data and how do u trade the setups which are formed and closing hours of the mkt which is followed by a big gap up or a gap down and how effective it is to carry home postions based on the intrady charts the role of volatility say like what happened day before yesterday suddedn fall to 5700 and a quick recovery back to the days high in no time.. even though i ve data on it as i ve always relied on EOD data. Its interesting to see people posting and discussing on the time frame and diffrent setups.. what is the role of money management in using this real time data and how do u trade the setups which are formed and closing hours of the mkt which is followed by a big gap up or a gap down and how effective it is to carry home postions based on the intrady charts the role of volatility say like what happened day before yesterday suddedn fall to 5700 and a quick recovery back to the days high in no time..
Regards
Manju
|
hii manju, thanks for ur intertest
yes, intraday trading is really risky affair and we can do it only on less volatile days
the following points we consider to trade in our set ups
1. at first we look at the market trend and try to go by it only, contra trend trade can be done but that is generally less profitable
2. we concentrate on bullish/bearish patterns in 60 min tf mostly
2.a) we use 60 min for robust gain only, if u use 5 min tf or any lesser tf u have to buy and book very fast which sometimes is a problem for a part time trader like sumesh bhai( a PSU executive ) or vishy(s/w engg) but thats okey for ppl like me who can stick to the monitor to book as soon as possible
so mostly we use 60 min tf
2.b) we need bullish/bearish pattern, means we generally avoid symmetrical triangle/pennant bcoz it can go any where, we trade mostly ascending triangles and descending triangles, and some times flgs too, for a definite directional bias
3. now after getting a set up, we check macd , for bullish we need macd in buy mode and for bearish we need it in sell mode, this the most important thing
4.after macd we check rsi, we generally avoid divergence case, as it results mostly false or one candle break out which we call fake out
5.now after a break out or break down in 60 min chart, after the candle.(bo/bd candle) closing above /below the bo/bd level we take position
6. we have great respect to weekly /monthly pivot levels and 34/89 ema so we use it as our potential targets and never thinks to go through them easily,
some times our bo/bd levels comes very near to these levels then we consider these levels as actual bo levels and take positions only after convincingly breaking them
7.finally only when the market permits, we carry over night positions or else we prefer to finish it within 3 pm becoz of higher leverage available in intra trade and possible risk of gap up gap down on next day
in short this is our trading system
|
|
| Back to top |
|
|
Ravi_S
Yellow Belt

Joined: 15 Jun 2009
Posts: 569
|
| Post: #1383 Posted: Thu Jan 13, 2011 1:30 pm Post subject: |
|
|
NF can take support at 5730 - 35.... Lets see... 
|
|
| Back to top |
|
|
singh.ravee
Yellow Belt
Joined: 12 Aug 2010
Posts: 678
|
| Post: #1384 Posted: Thu Jan 13, 2011 1:35 pm Post subject: |
|
|
sherbaaz hello,
i normally trade on 5-35 ema crossover. i initiate trade when ema start diverging after crossover.
U were refering to slope of ema line. can u kindly explain the use of slope of ema line in trading.
thanks and regards
ravee
|
|
| Back to top |
|
|
Ravi_S
Yellow Belt
Joined: 15 Jun 2009
Posts: 569
|
| Post: #1385 Posted: Thu Jan 13, 2011 1:40 pm Post subject: |
|
|
Ravee...
Slope of the ema refers to the angle of the ema line with the base... To get it right... the EMA line should be in the 2 o'clock position to be bullish and 4'0 clock position to be bearish..
Regards
Ravi
| singh.ravee wrote: | sherbaaz hello,
i normally trade on 5-35 ema crossover. i initiate trade when ema start diverging after crossover.
U were refering to slope of ema line. can u kindly explain the use of slope of ema line in trading.
thanks and regards
ravee |
|
|
| Back to top |
|
|
as4manju
White Belt

Joined: 22 Mar 2007
Posts: 390
|
| Post: #1386 Posted: Thu Jan 13, 2011 1:59 pm Post subject: |
|
|
Thanks casper...
Its been a good learning for me and still long way to for me cause i never look into these minute details... and more over i trade very less cause i just do this analysis as its a passion for me.. even i work in one of the big name of the IT industry its just in middle of work i keep doing these things.. hope to learn more from u going forward
Regards
Manju
| casper wrote: | | as4manju wrote: | Hi Casper,
It might sound silly or funny though its simple things i want to know about intra day charts as i ve never used it even though i ve data on it as i ve always relied on EOD data. Its interesting to see people posting and discussing on the time frame and diffrent setups.. what is the role of money management in using this real time data and how do u trade the setups which are formed and closing hours of the mkt which is followed by a big gap up or a gap down and how effective it is to carry home postions based on the intrady charts the role of volatility say like what happened day before yesterday suddedn fall to 5700 and a quick recovery back to the days high in no time..
Regards
Manju
|
hii manju, thanks for ur intertest
yes, intraday trading is really risky affair and we can do it only on less volatile days
the following points we consider to trade in our set ups
1. at first we look at the market trend and try to go by it only, contra trend trade can be done but that is generally less profitable
2. we concentrate on bullish/bearish patterns in 60 min tf mostly
2.a) we use 60 min for robust gain only, if u use 5 min tf or any lesser tf u have to buy and book very fast which sometimes is a problem for a part time trader like sumesh bhai( a PSU executive ) or vishy(s/w engg) but thats okey for ppl like me who can stick to the monitor to book as soon as possible
so mostly we use 60 min tf
2.b) we need bullish/bearish pattern, means we generally avoid symmetrical triangle/pennant bcoz it can go any where, we trade mostly ascending triangles and descending triangles, and some times flgs too, for a definite directional bias
3. now after getting a set up, we check macd , for bullish we need macd in buy mode and for bearish we need it in sell mode, this the most important thing
4.after macd we check rsi, we generally avoid divergence case, as it results mostly false or one candle break out which we call fake out
5.now after a break out or break down in 60 min chart, after the candle.(bo/bd candle) closing above /below the bo/bd level we take position
6. we have great respect to weekly /monthly pivot levels and 34/89 ema so we use it as our potential targets and never thinks to go through them easily,
some times our bo/bd levels comes very near to these levels then we consider these levels as actual bo levels and take positions only after convincingly breaking them
7.finally only when the market permits, we carry over night positions or else we prefer to finish it within 3 pm becoz of higher leverage available in intra trade and possible risk of gap up gap down on next day
in short this is our trading system |
|
|
| Back to top |
|
|
casper
Green Belt
Joined: 02 Oct 2010
Posts: 1315
|
| Post: #1387 Posted: Thu Jan 13, 2011 2:26 pm Post subject: |
|
|
hi manju
yes due to so much detailing me too trade very little, u know most of the folks thinks day trading is a gambling, but if systematically done can be a source of good income opportunity as well
at first these things remains quite confusing,its practice which makes perfect . as of me, i am only 26 and may be one of the youngest ichartians i am also under learning process
in normal days our system gives us almost unbelievable returns regularly but like many other things it has its huge draw backs also
for instance, during volatile days we have troubles with sl system and so on
but in relatively quite atmosphere it really works and thats the only respite for us
like many of my brothers, i also lack any formal education in T.A so by trail and error method, we are trying to improve it and fix up its loop holes
i hope in future we will be able to improve it so that we can counter its draw backs effectively
(even today i am not trading, just testing a few methods to find if they could fix the probs or not)
|
|
| Back to top |
|
|
ali522003
White Belt
Joined: 03 Jul 2010
Posts: 217
|
| Post: #1388 Posted: Thu Jan 13, 2011 2:41 pm Post subject: |
|
|
| casper wrote: | hi manju
yes due to so much detailing me too trade very little, u know most of the folks thinks day trading is a gambling, but if systematically done can be a source of good income opportunity as well
at first these things remains quite confusing,its practice which makes perfect . as of me, i am only 26 and may be one of the youngest ichartians i am also under learning process
in normal days our system gives us almost unbelievable returns regularly but like many other things it has its huge draw backs also
for instance, during volatile days we have troubles with sl system and so on
but in relatively quite atmosphere it really works and thats the only respite for us
like many of my brothers, i also lack any formal education in T.A so by trail and error method, we are trying to improve it and fix up its loop holes
i hope in future we will be able to improve it so that we can counter its draw backs effectively
(even today i am not trading, just testing a few methods to find if they could fix the probs or not) |
Keep it up casper bhai,, we are with u
|
|
| Back to top |
|
|
as4manju
White Belt
Joined: 22 Mar 2007
Posts: 390
|
| Post: #1389 Posted: Thu Jan 13, 2011 2:45 pm Post subject: |
|
|
Very true of what you said.... people feel that if they can understand TA its over they can make money but i feel learning TA is no big deal but its perfecting your trading system which is the most important thing i guess we also need to get educted on the behavioural and physiological aspects in the mkt most of the traders go wrong cause its not that they dont know things but its just they cant control the emotions of "greed and fear".. Even i m not too old to preach i m just 28 n started in mkt quite early and learnt things the hard way loosing big money
Regards
Manju
| casper wrote: | hi manju
yes due to so much detailing me too trade very little, u know most of the folks thinks day trading is a gambling, but if systematically done can be a source of good income opportunity as well
at first these things remains quite confusing,its practice which makes perfect . as of me, i am only 26 and may be one of the youngest ichartians i am also under learning process
in normal days our system gives us almost unbelievable returns regularly but like many other things it has its huge draw backs also
for instance, during volatile days we have troubles with sl system and so on
but in relatively quite atmosphere it really works and thats the only respite for us
like many of my brothers, i also lack any formal education in T.A so by trail and error method, we are trying to improve it and fix up its loop holes
i hope in future we will be able to improve it so that we can counter its draw backs effectively
(even today i am not trading, just testing a few methods to find if they could fix the probs or not) |
|
|
| Back to top |
|
|
Ravi_S
Yellow Belt
Joined: 15 Jun 2009
Posts: 569
|
| Post: #1390 Posted: Thu Jan 13, 2011 3:15 pm Post subject: |
|
|
I'm new...
| Ravi_S wrote: | | NF can take support at 5730 - 35.... Lets see... |
|
|
| Back to top |
|
|
sherbaaz
Yellow Belt
Joined: 27 May 2009
Posts: 543
|
| Post: #1391 Posted: Thu Jan 13, 2011 3:56 pm Post subject: |
|
|
| singh.ravee wrote: | sherbaaz hello,
i normally trade on 5-35 ema crossover. i initiate trade when ema start diverging after crossover.
U were refering to slope of ema line. can u kindly explain the use of slope of ema line in trading.
thanks and regards
ravee |
Hi,
There is for me no hard and fast rule for the slope of the moving average. Ravi has rightly pointed about the technical aspect of it.
I take TA as an ART rather than science. I will try to post some charts which shows the slope of ema/ma. its no difficult to understand just observe wht ever avgs you are using. there comes a time when rising direction of avg start getting flat even though the short term avg is above long term avg. this is the first sign of consolidation taking entry be it long or short would not fetch you good profits. keep away when such slope happens in averages.
I will try further post some other things on the above.
Regards,
|
|
| Back to top |
|
|
sherbaaz
Yellow Belt
Joined: 27 May 2009
Posts: 543
|
| Post: #1392 Posted: Thu Jan 13, 2011 3:58 pm Post subject: |
|
|
| Ravi_S wrote: | I'm new...
| Ravi_S wrote: | | NF can take support at 5730 - 35.... Lets see... |
|
in nf 5725 is a good support which it tested couple of time but there is no closing below this point if this level broken thn we may see nf going too 5585 5425 eod basis.
regards,
|
|
| Back to top |
|
|
deepakms
White Belt
Joined: 13 Aug 2009
Posts: 194
|
| Post: #1393 Posted: Thu Jan 13, 2011 7:39 pm Post subject: |
|
|
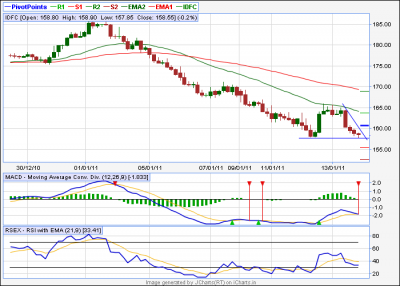
Casper/Sumesh
Ur views required pls..............ONGC and IDFC
Thnx/Rgds
Deeppak
| Description: |
|
| Filesize: |
27.42 KB |
| Viewed: |
139 Time(s) |
|
| Description: |
|
| Filesize: |
29.06 KB |
| Viewed: |
152 Time(s) |

|
|
|
| Back to top |
|
|
singh.ravee
Yellow Belt
Joined: 12 Aug 2010
Posts: 678
|
| Post: #1394 Posted: Thu Jan 13, 2011 7:59 pm Post subject: |
|
|
Casper Hi,
I am attaching 5min chart of nifty spot. Would like to learn following;
1. this divergence occured in last hours of trade. If we spot this kind of divergence, can we short in last 15- 20 minutes of the day for next day. May be something opposite of BTST, Sell Today Buy Tommorrow.
2. Whats the optimum time frame to spot divergence. Is 5 min enough time to spot divergence.
3. Whats the optimum number of candles required to complete divergence, if any such parameter exist.
Thanks and Regards
Ravee.
|
|
| Back to top |
|
|
singh.ravee
Yellow Belt
Joined: 12 Aug 2010
Posts: 678
|
| Post: #1395 Posted: Thu Jan 13, 2011 8:01 pm Post subject: |
|
|
ravi hi,
Your funda of 2o'clock and 4 o'clock is quite impressive. I back tested it on many charts with 35ema.
keep sharing
thanks and regards
ravee
|
|
| Back to top |
|
|
|
|
You cannot post new topics in this forum
You cannot reply to topics in this forum
You cannot edit your posts in this forum
You cannot delete your posts in this forum
You cannot vote in polls in this forum
You can attach files in this forum
You can download files in this forum
|
Powered by phpBB © 2001, 2005 phpBB Group
|
|
|


