|
|
| View previous topic :: View next topic |
| Author |
a layman's approach to break out and break down |
aromal
White Belt

Joined: 22 Mar 2010
Posts: 302
|
Post: #1396  Posted: Thu Jan 13, 2011 8:52 pm Post subject: Posted: Thu Jan 13, 2011 8:52 pm Post subject: |
 |
|
| deepakms wrote: | Casper/Sumesh
Ur views required pls..............ONGC and IDFC
Thnx/Rgds
Deeppak |
 idfc idfc
|
|
| Back to top |
|
 |
|
| |
casper
Green Belt

Joined: 02 Oct 2010
Posts: 1315
|
| Post: #1397 Posted: Thu Jan 13, 2011 10:00 pm Post subject: |
|
|
| deepakms wrote: | Casper/Sumesh
Ur views required pls..............ONGC and IDFC
Thnx/Rgds
Deeppak |
i am bullish on ongc for this set up but will be cautious on ifdc, because we have + div in idfc, if it holds the low of 158 then i hope it can go up also
in that case 165 should be the target
for ongc, it looks like quite impressive set up, just it needs to break and hold above 34 ema to break out, target aprox 1240 (89 ema)
|
|
| Back to top |
|
|
casper
Green Belt
Joined: 02 Oct 2010
Posts: 1315
|
| Post: #1398 Posted: Thu Jan 13, 2011 10:31 pm Post subject: |
|
|
| singh.ravee wrote: | Casper Hi,
I am attaching 5min chart of nifty spot. Would like to learn following;
1. this divergence occured in last hours of trade. If we spot this kind of divergence, can we short in last 15- 20 minutes of the day for next day. May be something opposite of BTST, Sell Today Buy Tommorrow.
2. Whats the optimum time frame to spot divergence. Is 5 min enough time to spot divergence.
3. Whats the optimum number of candles required to complete divergence, if any such parameter exist.
Thanks and Regards
Ravee. |
ur chart is not attached ravee, so let me tell u a story
u know yesterday i made a considerable loss in hdfc, i was frustrated, not for my loss but for ali, as he was following me and lost too
he got a few good trades but for last two days things are getting worst. and if some one get loss by following u then u just cant excuse urself
so, overall , totally frustrated i was sitting and smoking, not trading but watching market and trying to find out what went wrong
suddenly i got a few good set ups and told ali also, he was encouraging me to find out where to entry and believe me, i found where to entry and when to exit already, but neither i taken position nor i let him take position
ali is a nice boy, of my age, he did not complained any thing but i could feel that he has reason to be angry with me, as he lost and then i told him about set up but not letting him trade to cover his loss
u know, without even bathing or lunch, i stayed full time in the market and done nothing, just watching the market and charts
around 3 pm i told him " if aloke text closes above 26.30 go long in btst and hold it for two days in future, let us both take it around 3.20 or so, and hold it"
he was very happy, aloke's lot size is 10k, if it gives us 1 rupee then it is 10k profit and my supposed sl should be below 26, so we are about to risk only 30 paisa means 3 k. so overall good ratio
from 3.10 he started, "bhai bolo kab lena hai, i am ready bhai"
i was waiting for nifty to breach 5872 in spot as it will break monthly resistance and 34 ema both by then and we may have a safer journey ahead
which, as u know did not happened, ali (and me also) got impatient so was about to buy but then i stopped him again
i was sure that he thought i was like playing with him, but then i told him that apart from not breaking resistance i see - div in 5 min nifty, nifty may not sustain it is bound to come down. it wa sat 3.15 or so
but eventually market closed and nifty did not fall
i am sure my brother ali was not satisfied with my explanation for not trading at that time
but see today what happened, all is red, be it nifty be it aloke
so the moral of my story is, if a + div comes near a strong support or a - div comes near a strong resistance, then the chance of reversal increases considerably. and for spotting divergence, try to start with lower tf, as divergence first appear in lesser tf then spreads in other higher tfs,
while any tf below 5 min is too lesser, u can work with 5 min at ease
there is no hard and fast rules that how many candles should be considered, at least i dont know any such rule, but the closer the candles the stronger the signal because in case of a very close candle to candle or top to top or bottom to bottom divergence u will be able to judge the instant change of mentality of the market participants very nicely
|
|
| Back to top |
|
|
Ravi_S
Yellow Belt

Joined: 15 Jun 2009
Posts: 569
|
| Post: #1399 Posted: Thu Jan 13, 2011 10:34 pm Post subject: |
|
|
Casper,
Do you see a pennant here in ONGC hourly? Pattern recognizion is purely based on one's perspective... If this is a Pennant how do you trade?
Regards
Ravi
| Description: |
|
| Filesize: |
9.68 KB |
| Viewed: |
790 Time(s) |
|
|
|
| Back to top |
|
|
casper
Green Belt
Joined: 02 Oct 2010
Posts: 1315
|
| Post: #1400 Posted: Thu Jan 13, 2011 11:29 pm Post subject: |
|
|
| Ravi_S wrote: | Casper,
Do you see a pennant here in ONGC hourly? Pattern recognizion is purely based on one's perspective... If this is a Pennant how do you trade?
Regards
Ravi |
hmmm,
let me fry ur brain with some basic discussion 1st  (if u dont mind) (if u dont mind)
let us think why pennant /symmetrical triangle forms? and why an AT forms?
1. when we have lower highs and higher lows in a very fast condensed trading zone then only we get a pennant or ST
2. and if we get a few higher lows but equal highs in a condensed zone then only we have an AT
that is the reason of AT getting a bullish bias ( becoz of higher low) and pennants /symmetrical triangle getting a neutral bias (bcoz of lower high but higher low)
now let us examine this ongc minutely
1. we can easily discount the free falling part of ongc becoz it has not formed any trading range, it was a heavily trending phase (down trend obviously)
2. now our trading range is 1148 to 1200 aprox where the stock made some spiral movement making a trading range effectively
3. in this range if we consider the low before the 1148 low then we are not in position to draw a lower tl, so effective range should be from 1148 low
form this1148 low, we have got two higher lows but the corresponding tops are almost same means equal tops at 1200 level
so going by the definition, we have higher low and equal tops so now ravi bhaiya, we should call it AT not pennant any more
what i wrote above is just my anticipation
now lets come to the trading perspective, if the market is not very volatile and we have no gap up opening in ongc , i will buy with a bo with a 60min candle closing and trail it
i am trying to develop another type of trading technique for bo, but as i hv not tested it extensively, so i am not writing about that now
|
|
| Back to top |
|
|
casper
Green Belt
Joined: 02 Oct 2010
Posts: 1315
|
| Post: #1401 Posted: Fri Jan 14, 2011 8:56 am Post subject: |
|
|
update on ONGC
i saw some negative divergence in 5 min tf chart. we need to be careful here
1.it may come down to weekly support level before giving actual bo
2.only if it sustain above 1200 by 60 min candle close with good volume then only we can consider it to enter
3. if it comes down and takes support at lower level, thne we can think about buying it after a candle close above bo level
4.if it gaps up during opening then plz switch to 5 min chart to see if the gap is filled or not, if the gap is filled then consider buying above bo level of 1200
i will track it closely today and will update in forum
|
|
| Back to top |
|
|
casper
Green Belt
Joined: 02 Oct 2010
Posts: 1315
|
| Post: #1402 Posted: Fri Jan 14, 2011 9:22 am Post subject: |
|
|
as i expected, ongc made a gap up opening and the current candle is going down, looks like that - div is paying off, lets see if it holds the support or not
monthly support is at 1183. in previous post i hv mistaken it for weekly support
|
|
| Back to top |
|
|
Ravi_S
Yellow Belt
Joined: 15 Jun 2009
Posts: 569
|
| Post: #1403 Posted: Fri Jan 14, 2011 9:29 am Post subject: |
|
|
cASPER ongc is breaking the support trend line
| casper wrote: | update on ONGC
i saw some negative divergence in 5 min tf chart. we need to be careful here
1.it may come down to weekly support level before giving actual bo
2.only if it sustain above 1200 by 60 min candle close with good volume then only we can consider it to enter
3. if it comes down and takes support at lower level, thne we can think about buying it after a candle close above bo level
4.if it gaps up during opening then plz switch to 5 min chart to see if the gap is filled or not, if the gap is filled then consider buying above bo level of 1200
i will track it closely today and will update in forum |
|
|
| Back to top |
|
|
casper
Green Belt
Joined: 02 Oct 2010
Posts: 1315
|
| Post: #1404 Posted: Fri Jan 14, 2011 9:35 am Post subject: |
|
|
yes, just like hdfc
a negetive div in 5 min followed by a gap up opening and then going down. i am following it to understand where i went wrong
|
|
| Back to top |
|
|
Ravi_S
Yellow Belt
Joined: 15 Jun 2009
Posts: 569
|
| Post: #1405 Posted: Fri Jan 14, 2011 9:36 am Post subject: |
|
|
ONGC gone into the woods... 
| casper wrote: | yes, just like hdfc
a negetive div in 5 min followed by a gap up opening and then going down. i am following it to understand where i went wrong |
|
|
| Back to top |
|
|
singh.ravee
Yellow Belt
Joined: 12 Aug 2010
Posts: 678
|
| Post: #1406 Posted: Fri Jan 14, 2011 10:03 am Post subject: |
|
|
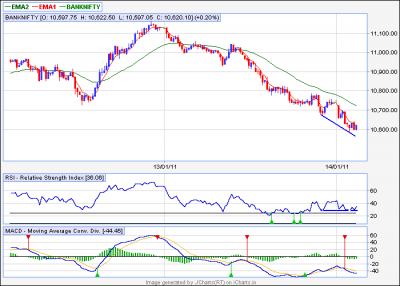
casper hello,
it is divergence in banknifty on 5min. 10600 is also a support zone
rgds
ravee
| Description: |
|
| Filesize: |
12.72 KB |
| Viewed: |
147 Time(s) |
|
|
|
| Back to top |
|
|
sumesh_sol
Brown Belt

Joined: 06 Jun 2010
Posts: 2344
|
| Post: #1407 Posted: Fri Jan 14, 2011 10:24 am Post subject: PETRONET |
|
|
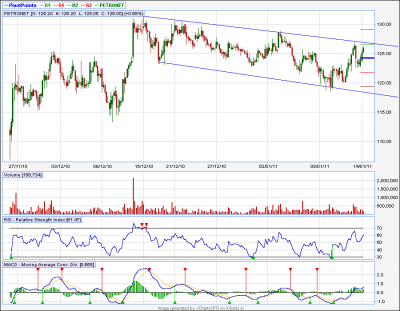
PETRONET
************
Nowaday, pure AT/DT are difficult to locate, so I though we should go with channel based trading untill market stabilizaties..
A strong close(hourly) above 127 can take petronet to (weekly r1) 131 and (depth of channel) 135..
Alternatively we can think of shorting at around 127 level with SL of candle close above 127.5 or so...
Please trade small qty, if such trades are successful then increase your qty.
-Sumesh
| Description: |
|
| Filesize: |
22.78 KB |
| Viewed: |
145 Time(s) |
|
Last edited by sumesh_sol on Fri Jan 14, 2011 10:26 am; edited 1 time in total |
|
| Back to top |
|
|
Ravi_S
Yellow Belt
Joined: 15 Jun 2009
Posts: 569
|
|
| Back to top |
|
|
Ravi_S
Yellow Belt
Joined: 15 Jun 2009
Posts: 569
|
| Post: #1409 Posted: Fri Jan 14, 2011 11:32 am Post subject: |
|
|
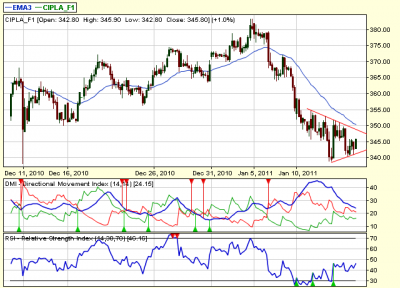
CIPLA broke the trendline on the resistance... What next?
Regards
Ravi
| Ravi_S wrote: | Brilliant Trend line game going on in CIPLA.. Eagerly waiting for the break out... Lets' wait and watch...
Regards
Ravi |
|
|
| Back to top |
|
|
Ravi_S
Yellow Belt
Joined: 15 Jun 2009
Posts: 569
|
| Post: #1410 Posted: Fri Jan 14, 2011 12:29 pm Post subject: |
|
|
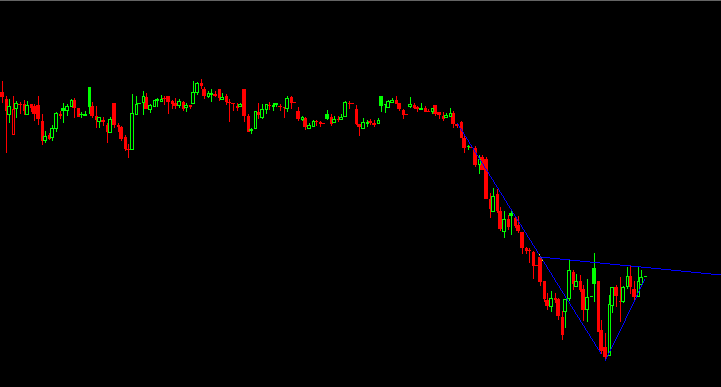
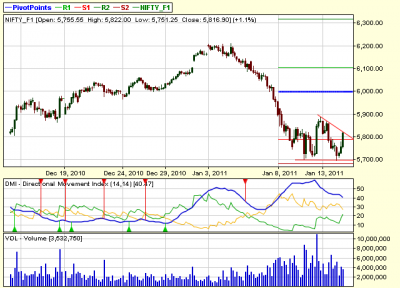
NF tested the trendline... Reversal possible from 5822 levels... Experts input needed...
Regards
Ravi
| Description: |
|
| Filesize: |
20.2 KB |
| Viewed: |
155 Time(s) |
|
|
|
| Back to top |
|
|
|
|
You cannot post new topics in this forum
You cannot reply to topics in this forum
You cannot edit your posts in this forum
You cannot delete your posts in this forum
You cannot vote in polls in this forum
You can attach files in this forum
You can download files in this forum
|
Powered by phpBB © 2001, 2005 phpBB Group
|
|
|