|
|
| View previous topic :: View next topic |
| Author |
a layman's approach to break out and break down |
singh.ravee
Yellow Belt

Joined: 12 Aug 2010
Posts: 678
|
Post: #1411  Posted: Fri Jan 14, 2011 1:27 pm Post subject: Posted: Fri Jan 14, 2011 1:27 pm Post subject: |
 |
|
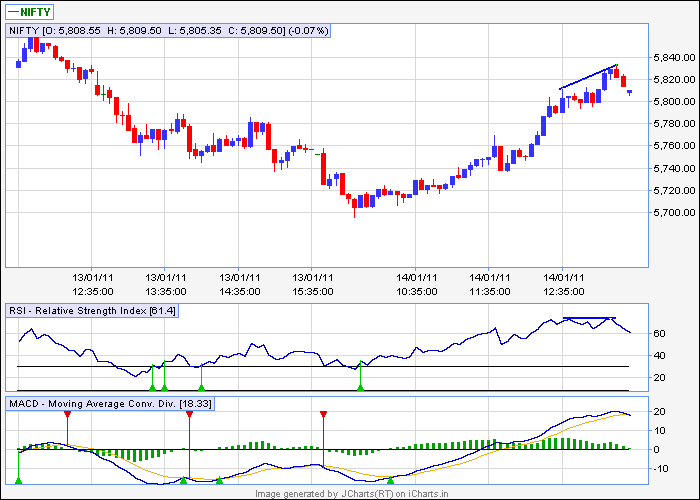
Ravi_S,
attached chart is of nifty 5min showing negative divergence. 60 min, falling tl is giving resistance. can we go short if tl rejects price movement.
rgds
ravee
| Description: |
|
| Filesize: |
11.67 KB |
| Viewed: |
738 Time(s) |
|
|
|
| Back to top |
|
 |
|
| |
Ravi_S
Yellow Belt
Joined: 15 Jun 2009
Posts: 569
|
| Post: #1412 Posted: Fri Jan 14, 2011 1:38 pm Post subject: |
|
|
Don't short it yet... NVK is in the making in yahoo charts and 5 mins charts... lets wait for that...
| singh.ravee wrote: | Ravi_S,
attached chart is of nifty 5min showing negative divergence. 60 min, falling tl is giving resistance. can we go short if tl rejects price movement.
rgds
ravee |
|
|
| Back to top |
|
|
casper
Green Belt

Joined: 02 Oct 2010
Posts: 1315
|
| Post: #1413 Posted: Fri Jan 14, 2011 3:13 pm Post subject: |
|
|
hiii guys
today i had a realy realy nice trade in ONGC,
i have applied all what i learnt from HDFC massacre and got very good returns too

vishy and ali were with me in messenger, i told them what and when i am doing but restricted them to trade as i was not sure of its results.
i just checked today what i have learnt on the day before yesterday
and i am satisfied with the long trade result, but i shorted it also, then seeing square up time approaching, i had to book it early, so short trade is not that satisfactory
i have taken snap shot of ongc charts when and where it was possible for me
as i was holding really a big position as per my slandered so i could not catch all the moments
as like any of u, me too also suffer from tension while in market ,specially when i am doing something for the 1st time
for this ongc, i could not have my bath/ lunch today
so now going to finish them
and then i will come back and post whatever i got from this trade with charts
VISHAL, ichart id mrvishal_g has helped me a lot to solve this puzzle, he made several STD calls to me just to help me and shared the valuable inputs he got from a legendary trader MR.ASHOK WADHA of DELHI (his mentor) during his training
vishal is just like my elder brother, so i cant say thank u, bcoz it may be an insult to his love and care for me
ravee, sorry brother i could not reply ur BNF post, i was really tensed
plz dont mind
|
|
| Back to top |
|
|
ali522003
White Belt

Joined: 03 Jul 2010
Posts: 217
|
| Post: #1414 Posted: Fri Jan 14, 2011 3:18 pm Post subject: |
|
|
| casper wrote: | hiii guys
today i had a realy realy nice trade in ONGC,
i have applied all what i learnt from HDFC massacre and got very good returns too
vishy and ali were with me in messenger, i told them what and when i am doing but restricted them to trade as i was not sure of its results.
i just checked today what i have learnt on the day before yesterday
and i am satisfied with the long trade result, but i shorted it also, then seeing square up time approaching, i had to book it early, so short trade is not that satisfactory
i have taken snap shot of ongc charts when and where it was possible for me
as i was holding really a big position as per my slandered so i could not catch all the moments
as like any of u, me too also suffer from tension while in market ,specially when i am doing something for the 1st time
for this ongc, i could not have my bath/ lunch today
so now going to finish them
and then i will come back and post whatever i got from this trade with charts
VISHAL, ichart id mrvishal_g has helped me a lot to solve this puzzle, he made several STD calls to me just to help me and shared the valuable inputs he got from a legendary trader MR.ASHOK WADHA of DELHI (his mentor) during his training
vishal is just like my elder brother, so i cant say thank u, bcoz it may be an insult to his love and care for me
ravee, sorry brother i could not reply ur BNF post, i was really tensed
plz dont mind |
casper bhi we will be looking desperately for the method you used in ongc..
|
|
| Back to top |
|
|
sherbaaz
Yellow Belt
Joined: 27 May 2009
Posts: 543
|
| Post: #1415 Posted: Fri Jan 14, 2011 5:11 pm Post subject: |
|
|
| Ravi_S wrote: | NF tested the trendline... Reversal possible from 5822 levels... Experts input needed...
Regards
Ravi |
put 34 ema and see the difference
reagrds
|
|
| Back to top |
|
|
singh.ravee
Yellow Belt
Joined: 12 Aug 2010
Posts: 678
|
| Post: #1416 Posted: Fri Jan 14, 2011 5:48 pm Post subject: |
|
|
casper bhai,
no issues about bnf.
sherbaaz bhai n ravi_s bhai,
i traded nifty today. as it reached around 5800+ level. i could see shooting star being rejected from 35ema. I opened short and feel satisfied with todays trade.
|
|
| Back to top |
|
|
Ravi_S
Yellow Belt
Joined: 15 Jun 2009
Posts: 569
|
| Post: #1417 Posted: Fri Jan 14, 2011 7:39 pm Post subject: |
|
|
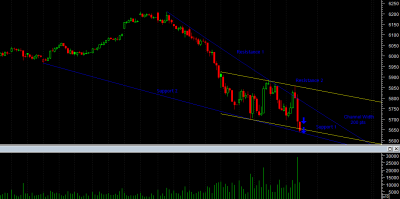
Is there a 200 pts downside from the current level? Here is my Analysis... Please comment...
| Description: |
|
| Filesize: |
35.27 KB |
| Viewed: |
169 Time(s) |
|
|
|
| Back to top |
|
|
newinvestor
White Belt
Joined: 16 Feb 2010
Posts: 120
|
| Post: #1418 Posted: Fri Jan 14, 2011 8:03 pm Post subject: |
|
|
| singh.ravee wrote: | casper bhai,
no issues about bnf.
sherbaaz bhai n ravi_s bhai,
i traded nifty today. as it reached around 5800+ level. i could see shooting star being rejected from 35ema. I opened short and feel satisfied with todays trade. |
Good, Ravee. What TF you used? 5 mins?
|
|
| Back to top |
|
|
casper
Green Belt
Joined: 02 Oct 2010
Posts: 1315
|
| Post: #1419 Posted: Fri Jan 14, 2011 9:43 pm Post subject: |
|
|
hi all
2 days ago i had made a huge loss in HDFC. today i hv got almost same set up in ONGC, and going by my experience of hdfc and some testing which i made yesterday, i traded ONGC today.
here i am sharing the same with u, see if any of u could use /refine it
HDFC SITUATION
hdfc in real time chart. was an at, in 60 min tf it had got + div while in 5 min tf it had got -div. the stock opened in gap up manner which was not shown in 60 min chart. and i have mistaken it for a break out candle and taken position with the candle close. then due to the - div in smaller tf and gap up opening, it came down heavily to form a sort of bearish flag. which had a strong support around 650 and after getting the support, it went on to make some 684 as new high.
during the going down of 2nd hourly candle i had to close my position with heavy loss
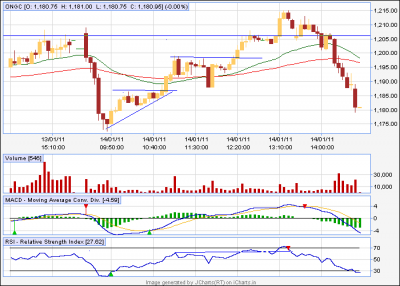
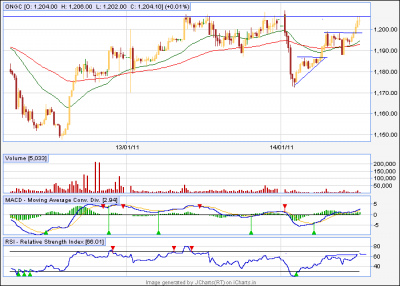
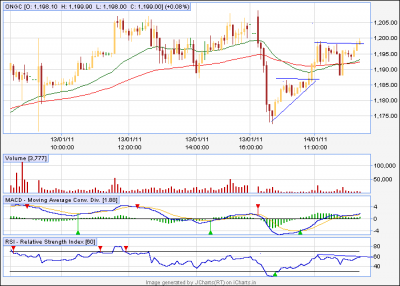
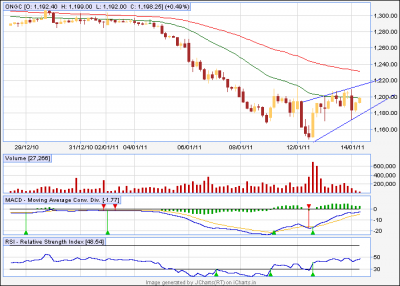
ONGC
PRE-MARKET: ongc was just like hdfc, an at real time tf, 60min chart had got +div and 5 min chart had got - div, u can say a photo copy of hdfc
OPENING: just like hdfc, it made a gap up opening, which was not visible in 60 min chart but was clearly visible in 5 min, and as i expected it came down heavily within 15 minutes of opening and was arrested around 1180 range, forming a sort of bearish flag
MY TRADES:
1. i switched immediately to 5 min tf and never get back in 60 min , i knew if this flag breaks out then i will be simply wiped out. so i waited to find the bottom
2.then after some time, i saw an at is forming in 5 min tf, now after the fall, i was sure that the effect of negative divergence in lesser tf paid off its the turn of the + div now
3. i bought in large quantity, almost double of what i usually trade, the picture of HDFC day was in my eyes, i was tensed but some how manged to buy and after buying i started cursing myself. i bought it aprox 1182 level
4.within a few minutes of buying that at broken out reaching near 1200 range, i was so happy, i thought to book some, but instead of booking, i kept a trailing sl
5.then i think, due to inflation number or something like this, we got a one candle correction which immediately covered in the very next candle, confirming the bullishness even more
6.after some time, i got a divergence, a negative div, i got really scarred now, but as the candle closed higher so double top had not formed , i thanked my god
7. now i see we are at previous resistance level of 1208, so i was waiting to break it for even more up move, vishy shouted, " buddy we got an inv h/s, neck line is at 1208"
i said to myself, "dont wait man, off load at least half of ur bulk now and keep strict sl for the rest " so i booked 50% at 1207 some thing
8. then it broken out, price zoomed to 1215 aprx, naturally i could not book it there, i got trailing sl which was hit at 1210 and i was out of long trade, but with good money
9. finally in 5 min tf i saw a small dt, just above the neck line of 1208, but 34 ema was supporting
very casually i shorted it while chatting with ali, and said him that let me make up my brokerage by this short but bhai u dont enter, it has strong support, u dont have chart so u wont be able to book, i need to book it very fast
10. i hv not checked nifty, so i was clueless of what is going to happen. again after shorting, i started cursing myself, becoz my short was bouncing back. ali bhai was asking me" bhai whats ur sl? its going up?"
i said let it be 1210 and i will be out. i was short at 1207
then it went down suddenly, it was 1200, i did not waited, nor i trailed it, just booked it at 1200, only to see price going down 1198,1195,1190..... 1180
again i started blaming my luck, why i have not waited for merely two more minutes? i booked it near 89 ema in 5 min tf, but price broken that ema like someone cutting butter with a knife
but then, i had no chance left
so this was my experience with ONGC, one of the best trades i have ever taken,
one thing i am sure of, if there is any more case like HDFC/ONGC. i will be more confident next time
| Description: |
|
| Filesize: |
13 KB |
| Viewed: |
155 Time(s) |
|
| Description: |
|
| Filesize: |
18.23 KB |
| Viewed: |
140 Time(s) |
|
| Description: |
|
| Filesize: |
13.49 KB |
| Viewed: |
141 Time(s) |
|
| Description: |
|
| Filesize: |
13.42 KB |
| Viewed: |
163 Time(s) |
|
| Description: |
|
| Filesize: |
13.42 KB |
| Viewed: |
140 Time(s) |

|
| Description: |
|
| Filesize: |
12.81 KB |
| Viewed: |
141 Time(s) |
|
|
|
| Back to top |
|
|
ravionlinek
White Belt
Joined: 11 Jun 2010
Posts: 97
|
| Post: #1420 Posted: Sat Jan 15, 2011 12:53 am Post subject: |
|
|
casper
just chek out Prajind
volume also good & 50/150/200 Ema are also moving upside........
look like above 89 tgt 98.....

|
|
| Back to top |
|
|
casper
Green Belt
Joined: 02 Oct 2010
Posts: 1315
|
| Post: #1421 Posted: Sat Jan 15, 2011 7:52 am Post subject: |
|
|
| ravionlinek wrote: | casper
just chek out Prajind
volume also good & 50/150/200 Ema are also moving upside........
look like above 89 tgt 98.....
|
my RT chart subscription gone today
going by the EOD charts i see 80 is the monthly pivot. i expect 80-77 range to provide strong support, it may go up if this level is held.
i have no real time data now but advising u to buy in such a falling market is not an wise decision from my part
|
|
| Back to top |
|
|
singh.ravee
Yellow Belt
Joined: 12 Aug 2010
Posts: 678
|
| Post: #1422 Posted: Sat Jan 15, 2011 9:31 am Post subject: |
|
|
Casper Hello,
Good to know that your hard work has paid u in the end. Keep sharing with us.
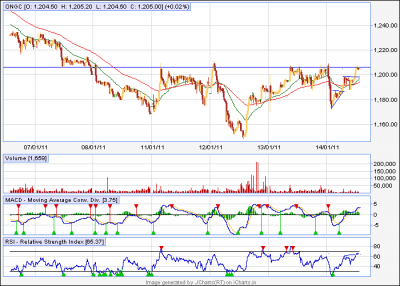
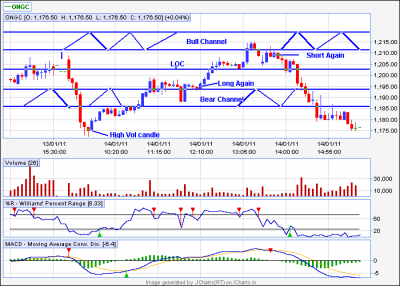
Would like to share with you my perspective on ONGC in 5min tf. For 5 min tf, I follow ST Sir's theory.
ONGC in EOD tf in last 3-4 days was in lateral move kind of thing and was failing to touch 1212. So I would have expected a good pullback above 1212.
1. ONGC opened above LOC, rejected from few points below bull channel, which can be viewed has rejection from 1212 and in first candle itself closed below LOC. MACD has sell signal, fast oscillator is Oversold. 2nd candle we can short with SL above LOC.
2. High vol candle in downtrend signaled end of downmove. An upmove started. We can expect bear channel to provide resistance. However it didn't happened. We can close short around 1185.
3. Around 12pm a tall candle broke above bear channel, consolidates and then takes off. We can re enter here. As expected bull channel provided resistance. We can cover around 1210.
4. Rejection from bull channel is reconfirmed around 1210 and we can again go short from these levels for first target of bear channel.
This is easy to sit now and utilise this theory to understand movement of ongc. However, doing the same during the trading hours is not that easy.
I really appreciate your efforts that u turned around the losses of hdfc with ongc.
Keep sharing.
Thanks and Regards
| Description: |
|
| Filesize: |
14.41 KB |
| Viewed: |
156 Time(s) |
|
|
|
| Back to top |
|
|
vishytns
White Belt
Joined: 26 Nov 2009
Posts: 206
|
| Post: #1423 Posted: Sat Jan 15, 2011 9:39 am Post subject: |
|
|
Ravee/Casper,
Rocking guys, good trading strategies explained. Keep up the good work.
Casper,
Congrats on your profits in ONGC. Great execution.
Vishy
|
|
| Back to top |
|
|
singh.ravee
Yellow Belt
Joined: 12 Aug 2010
Posts: 678
|
| Post: #1424 Posted: Sat Jan 15, 2011 10:08 am Post subject: |
|
|
Casper,
I always get trapped in understanding the difference between reversal and pullback. I read banknifty explaination of sherbaaz and reiterating those points. I request you and other experts to kindly provide your views on this.
Few points which will make a bottom reversal.
1. A strong bullish candle reversal signal in downtrend. If it comes at previous support/ resistance, its an added advantage.
2. Slope of 50 EMA. A downward sloping line is going to choke any upmove. However a flattish kind of 50 EMA is a weak signal. If stock manages to close above flattish 50EMA and then 50EMA starts sloping upwards, it signals reversal.
3. Any Close above immediate previous swing pivot point.
If its not happening then its a pullback or retracement in the current move.
Thanks and Regards
ravee
|
|
| Back to top |
|
|
casper
Green Belt
Joined: 02 Oct 2010
Posts: 1315
|
| Post: #1425 Posted: Sat Jan 15, 2011 10:23 am Post subject: |
|
|
| singh.ravee wrote: | Casper Hello,
Good to know that your hard work has paid u in the end. Keep sharing with us.
Would like to share with you my perspective on ONGC in 5min tf. For 5 min tf, I follow ST Sir's theory.
ONGC in EOD tf in last 3-4 days was in lateral move kind of thing and was failing to touch 1212. So I would have expected a good pullback above 1212.
1. ONGC opened above LOC, rejected from few points below bull channel, which can be viewed has rejection from 1212 and in first candle itself closed below LOC. MACD has sell signal, fast oscillator is Oversold. 2nd candle we can short with SL above LOC.
2. High vol candle in downtrend signaled end of downmove. An upmove started. We can expect bear channel to provide resistance. However it didn't happened. We can close short around 1185.
3. Around 12pm a tall candle broke above bear channel, consolidates and then takes off. We can re enter here. As expected bull channel provided resistance. We can cover around 1210.
4. Rejection from bull channel is reconfirmed around 1210 and we can again go short from these levels for first target of bear channel.
This is easy to sit now and utilise this theory to understand movement of ongc. However, doing the same during the trading hours is not that easy.
I really appreciate your efforts that u turned around the losses of hdfc with ongc.
Keep sharing.
Thanks and Regards |
hi ravee
i am pointing out a few basic elements. i fear there might have some misconception in ur judgement, so being ur brother, i would like to put them before u so that in future u may not have to be sorry
these are my ideas, may not be subscribed by any body also, but here i am sharing what i felt and only for betterment of both of us, as i may be wrong also
1.nowadays market has gone mad, it can go down to 100 pts and then pulled back for 70 pts only to go down again, killing most of the traders.
a few days ago, manju (i think) wrote in his thread that every single profit is coming with so many blood and corpses, i fully agree with him, in such an emergency like situation, i think referring EOD chart is a kind of waste of time, becoz though we reach eod targets still now, but with much more volatility which i fear can kill any body with out solid money management
money management is basically totally dependent on risk management ( or u can say, both are the same) and that is totally dependent on individuals psychology so one size fit all solution can not be given here, and thats why i feel, all of us are not that good risk manager, at least i am a poor fellow here
so in such a situation, going by eod isn't that suitable for me
2.u wrote " high vol candle in down trend signals end of downtrend, plz dont think like this
basically it is assumed that any trending candle with high vol signifies start or continuation of the trend, and certainly not the end of trend
end of trend is generally signaled by low volumes, not high volumes
when a high vol candle occurs generally its believed that big boys are favoring the trend, so going by the notion of high vol means end of trend will result havoc loss in future
3. then u mentioned that fast oscillator is oversold
i have not extensively used fast oscillator ever, but what i know about oscillator is
i) any oscillator oversold means it is overly sold so no more sell, it will pull back or at least become choppy
ii) and over bought means overly bought. and that means no more buy, it may become choppy or even go down
off-course there are lots of other things to watch with OB/OS levels
but if u think OS means more sell, then u will end up by selling at bottom and if OB means more buy to u then u may end up buying at the top
this is general notion about ANY oscillator unless the setting of the oscillator changed to signal some thing else
if u dont mind then i must say, situation of ongc was some thing like, u had a mathematical problem in ur hand and u come to the right answer, but u followed totally wrong path, which in later life may cause u damage
nowadays so many new experts( i am CERTAINLY NOT talking about ST sir) have their own view of trading, i respect them and i dont like controversy either
all that i want is to see all of my brothers becoming much more good analyst than those experts
i am sorry if i sound a little harsh
but i cant sit silently when, as per my believe, u r going in wrong direction, coz that will spoil my total effort of last 3 months or so
|
|
| Back to top |
|
|
|
|
You cannot post new topics in this forum
You cannot reply to topics in this forum
You cannot edit your posts in this forum
You cannot delete your posts in this forum
You cannot vote in polls in this forum
You can attach files in this forum
You can download files in this forum
|
Powered by phpBB © 2001, 2005 phpBB Group
|
|
|


