|
|
| View previous topic :: View next topic |
| Author |
a layman's approach to break out and break down |
casper
Green Belt

Joined: 02 Oct 2010
Posts: 1315
|
Post: #1441  Posted: Sun Jan 16, 2011 12:21 pm Post subject: Posted: Sun Jan 16, 2011 12:21 pm Post subject: |
 |
|
| singh.ravee wrote: | casper hello,
hope u r doing gr8.
i m attaching weekly chart of itc. is it a bearish divergence in itc? if yes, then probable tgt and sl.
thanks and regards
ravee |
yes it is a negative divergence
and u see after divergence, price started falling, that means divergence is working
i am repeatedly posting that we are going through some of the super cyclonic phase, in this market, support, resistance, stop loss, target, all the words really means nothing to me
cyclone is a speedy thing, so here we get volatility
i am from kolkata, here in Bengal we have a devastating storm every year, which, in Bengali, we call KAL-BOISAKHI
u know ravee, when i was a kid, my mummy used to shout on me and tried to keep me in the room during that storm, but being a kid (as all kids are adventurous) i alway tried to go out and enjoy
in those days, being completely unaware of what is the risk i was taking, i thought it was really a heroic work
u know, all are running to shelter, but i am, running to the play ground, all wet, my eyes are hazy with rains, the sound of storms, the sounds of trees which are getting uprooted, the sound of thundering and magnificent lights....... all used to give me a feelings that i am fighting with a monster and defeating him.........
i was unknown to the risk which i used to take for nothing, .............
yes for nothing
dont u see the same situation is here? all are staying away from market due to fear of loosing ........ and we are trying to explain the moves and making profit?
u know in storms i saw some senior fellows also, going for their inevitable duties as they have no chance but with much more protection, they knows the risk, they know their destinations, they are not adventuring, just they are performing their duties, but with much more protection, becoz, they know the risk very well
okey leave my delirium here, lets get back to the business
i have no real time data now, so cant give u target, but i am giving u a list, which ever is near, could be our 1st target, then 2nd one and so on
weekly/monthly pivots and associated r1/r2 s1/s2 level
34ema, 89 ema. and lower part of the bollinger band in eod chart
whomever comes in our way is our destination to book some profit
and let me chat with u a litlle more, plz dont be in hurry, after all its sunday, we are entitled to relax a lil. becoz from tomorrow we will have same monotonous activities
ravee, why are u planning to short itc? what u said? negative divergence in double top??? oh yes
so u expect that the - div will bring down the price? ok i understand
tell me when price will go up instead of going down?....... yes u r right, only when this - div is discounted.
ok how will u know that - div is discounted? ..... yes u r right again brother
if any higher top than the double top occurs in the price in chart, then only we can say that - div is getting discounted
so why not using a close above double top as our starting sl???
what u say? plz write to me
|
|
| Back to top |
|
 |
|
| |
casper
Green Belt
Joined: 02 Oct 2010
Posts: 1315
|
| Post: #1442 Posted: Sun Jan 16, 2011 12:30 pm Post subject: |
|
|
| singh.ravee wrote: | casper,
i use 50 ema as a tool to decide trend. price above 50ema= uptrend; price below 50 ema = downtrend. price negotiating with 50ema= flattish hence avoidable.
rgds
ravee |
thax ravee for putting ur version
i am not commenting on it now, u know we are working on this thread for a lil more than 3 months and our viewer number crossed 46k? that means almost 10 k per month at least
so i hope some more reply to come....... a few more........ so that i can assert what is going wrong with u guys
i will comment on it only after 8 pm in night, i really expect a few more replies from all of u, describing what u mean by up trend and down trend
we are technical analysts, or at least, technical traders, trend is the most important thing
like GANGA JALL to a hindu priest
so come on guys plz give me some idea, what uptrend/down trend means to u??
|
|
| Back to top |
|
|
singh.ravee
Yellow Belt

Joined: 12 Aug 2010
Posts: 678
|
| Post: #1443 Posted: Sun Jan 16, 2011 1:04 pm Post subject: |
|
|
casper,
i think kolkata is also a hub of technical analysts. I know few ppl who provide real time data feed based in kolkata. Today i came to know that u r from kolkata only.
According to me risk is a perception not a realty. Like on friday, i found shorting nifty @ 5800 easy and one of a friend find it risky. We may be looking at same thing, however our perception can vary significantly. I feel those who can rely upon their technical trading system, inspite of the fact that risk is high, they will be successful. Its easier said than done. Something similar to going out for a job in storm.
SL pt for itc is agreeable. I dont know how to calculate tgts for divergences. May be any of the method suggested by you will do.
Few charts that i saw today;
1. Sesagoa - double top in formation; neckline = 320; if broken then tgt = 300
2.tcs - cmp= 1120 bearish divergence in both daily as well as weekly charts.
Looking at all the charts i could see bearish activities. From where the strength will come in market. Lets see from monday onwards.
One more thing, 60min time frame is too good to trade.
Thanks and regards
ravee
|
|
| Back to top |
|
|
casper
Green Belt
Joined: 02 Oct 2010
Posts: 1315
|
| Post: #1444 Posted: Sun Jan 16, 2011 2:46 pm Post subject: |
|
|
| singh.ravee wrote: | casper,
i think kolkata is also a hub of technical analysts. I know few ppl who provide real time data feed based in kolkata. Today i came to know that u r from kolkata only.
According to me risk is a perception not a realty. Like on friday, i found shorting nifty @ 5800 easy and one of a friend find it risky. We may be looking at same thing, however our perception can vary significantly. I feel those who can rely upon their technical trading system, inspite of the fact that risk is high, they will be successful. Its easier said than done. Something similar to going out for a job in storm.
SL pt for itc is agreeable. I dont know how to calculate tgts for divergences. May be any of the method suggested by you will do.
Few charts that i saw today;
1. Sesagoa - double top in formation; neckline = 320; if broken then tgt = 300
2.tcs - cmp= 1120 bearish divergence in both daily as well as weekly charts.
Looking at all the charts i could see bearish activities. From where the strength will come in market. Lets see from monday onwards.
One more thing, 60min time frame is too good to trade.
Thanks and regards
ravee |
not only for divergence, but for any trade, i am planning not to project targets any more, i am planning to book at the possible levels which will comes in my way
by partial booking and keeping sl for the rest, i will be able to hold my position for the long and though my sl can be breached but at the same time, i wont end up holding a trade merely for target in an odd market and i wont close trade prematurely like my ongc short
and among possible levels , i prefer pivots and 34/89 ema to book,
only when nothing will be near me, i will go by the rough estimate of target which we get from the pattern itself
and for sl projection in ITC, i wrote some thing like a drama
the main thing i want to emphasis that THE REASON OF UR TRADE IS UR SL. like ITC, until we got another top above the double top, the divergence will be very much effective
so until the divergence is discounted, we have reason to hold our position
so i am trying to use the reason of trade as my sl
|
|
| Back to top |
|
|
Ravi_S
Yellow Belt
Joined: 15 Jun 2009
Posts: 569
|
| Post: #1445 Posted: Sun Jan 16, 2011 7:49 pm Post subject: |
|
|
Casper... Nice initiative...
Uptrend : Price forming higher highs...
Downtrend : Price forming lower lows...
Regards
Ravi
| casper wrote: | | singh.ravee wrote: | casper,
i use 50 ema as a tool to decide trend. price above 50ema= uptrend; price below 50 ema = downtrend. price negotiating with 50ema= flattish hence avoidable.
rgds
ravee |
thax ravee for putting ur version
i am not commenting on it now, u know we are working on this thread for a lil more than 3 months and our viewer number crossed 46k? that means almost 10 k per month at least
so i hope some more reply to come....... a few more........ so that i can assert what is going wrong with u guys
i will comment on it only after 8 pm in night, i really expect a few more replies from all of u, describing what u mean by up trend and down trend
we are technical analysts, or at least, technical traders, trend is the most important thing
like GANGA JALL to a hindu priest
so come on guys plz give me some idea, what uptrend/down trend means to u?? |
|
|
| Back to top |
|
|
MANUBINDRA
White Belt

Joined: 12 Dec 2010
Posts: 28
|
| Post: #1446 Posted: Sun Jan 16, 2011 8:09 pm Post subject: |
|
|
when scrip maintain its supports levels in case of uptrend, and resistance level in case of downtrend.
regards
M.Bindra
|
|
| Back to top |
|
|
chetan83
Brown Belt

Joined: 19 Feb 2010
Posts: 2036
|
| Post: #1447 Posted: Sun Jan 16, 2011 9:05 pm Post subject: Query!! |
|
|
Dear All,
Do we have the GTC facility in NSE trades? (as we have in MCX for commodity). By this facility, if we put a buy or sell order under GTC facility with the Limit price mentioned then the same is valid for that entire future period or till the time it is executed (whichever comes early). {For 27the Jan contract, same will be valid till 27th Jan or till the time trade is executed}.
This is available in MCX, I dont know whether it is in NSE or not.
Members can reply.
|
|
| Back to top |
|
|
Ravi_S
Yellow Belt
Joined: 15 Jun 2009
Posts: 569
|
| Post: #1448 Posted: Sun Jan 16, 2011 9:52 pm Post subject: |
|
|
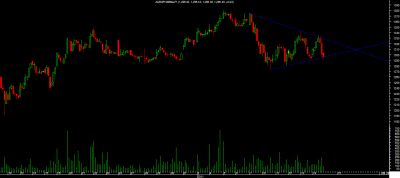
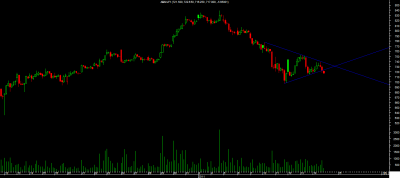
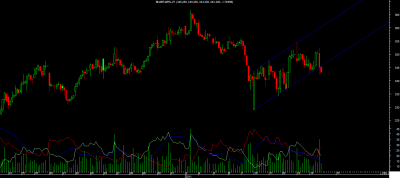
Some good candidates for Tomorrow  all 60 mins chart all 60 mins chart 
Regards
Ravi
| Description: |
| A small H&S pattern has also formed |
|
| Filesize: |
18.27 KB |
| Viewed: |
168 Time(s) |
|
| Description: |
|
| Filesize: |
16.31 KB |
| Viewed: |
157 Time(s) |
|
| Description: |
| Brilliant channel formed in BHARTI |
|
| Filesize: |
22 KB |
| Viewed: |
162 Time(s) |
|
|
|
| Back to top |
|
|
casper
Green Belt
Joined: 02 Oct 2010
Posts: 1315
|
| Post: #1449 Posted: Sun Jan 16, 2011 9:52 pm Post subject: |
|
|
so i got only 3 answers to my question???? 
i think nobody has taken it seriously. and among the three replies, only ravi bhaiya is correct, and he is much more senior trader than me, so it is expected from him also
now the definition of uptrend is the stock is forming higher low and higher highs
and the definition of downtrend is stock is forming lower lows and lower highs
now let me come to the point why i asked u about the definition
1. when u buy some stock, u expect it to be in uptrend, means u expect it to make higher highs and higher lows
2. when u short a stock, u expect it to be in down trend, means making lower highs and lower lows
i am sorry that to day i have no real time chart to show u as my subscription is expired, but i would like to post the ongc chart i already posted,( i only hv ongc chart with me, rest all are already deleted)
i am requesting all to verify what i am going to write with any of ur charts showing up trend and down trend
in fact i wanted to discuss the method of trailing stop i follow, as i have wrote to ravee that the reason of the trade is the sl
going by that idea, a stock is a buy as long as it maintains uptrend, and a stock is a sell as long as it is in down trend
(i am not talking about sup/resi levels now)
let us keep a trailing stop at the previous low or low of previous candle (depending up on ur aggressiveness) for a long trade in any tf
and let us keep a trailing stop at the previous high or high of previous candle for a short trade in any tf
in case of a long trade, when the price breaks the previous low by making lower low we are stopped out and trend is also reversed itsel;f by making a lower low in an uptrend
in case of a short trade, when the price breaks previous high, we are stopped out and trend is also reversed as it made higher high
in my opinion, trailing sl is meant for hit only, personally i always like to be trailing stopped out than merely square up, coz effective trailing will give us most of the juice the stock contains, off course it need some practice but it pays
u can keep it by a candle close also, even if u have strong control on ur mentality and quite ruthless while trading, then u dont give the order, keep it in ur mind, and if this get breached sell it without looking any way
then again, if u have a reason to buy, then buy again
at least in this way, u wont end up losing like hell
by da way, dont jump with joy and start playing with it in real market, find time to do some paper trades with it and if u see ifs good,u can use it always,
if some thing more interesting is in ur mind, then try to refine this also
i find this method is use full, when u r very sure of the trend, u can keep sl of previous candles high/low with some cushion
if u r not that aggressive then go by previous top or bottom levels also
in the attached chart of ongc, if u were following this method then u had chance to get stopped out at least twice, but i think with some money, u wont made any loss then
by da way, i have fever, plz dont mind if i have made any mistake while writing this
:
| Description: |
|
| Filesize: |
25.31 KB |
| Viewed: |
170 Time(s) |

|
|
|
| Back to top |
|
|
singh.ravee
Yellow Belt
Joined: 12 Aug 2010
Posts: 678
|
| Post: #1450 Posted: Mon Jan 17, 2011 8:23 am Post subject: |
|
|
casper hello,
wish u a speedy recovery.
rgds
ravee
|
|
| Back to top |
|
|
singh.ravee
Yellow Belt
Joined: 12 Aug 2010
Posts: 678
|
| Post: #1451 Posted: Mon Jan 17, 2011 10:17 am Post subject: |
|
|
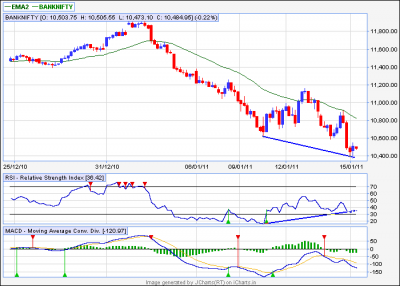
hi,
is it a bullish divergence in bank nifty.
rgds
ravee
| Description: |
|
| Filesize: |
12.69 KB |
| Viewed: |
152 Time(s) |
|
|
|
| Back to top |
|
|
Ravi_S
Yellow Belt
Joined: 15 Jun 2009
Posts: 569
|
| Post: #1452 Posted: Mon Jan 17, 2011 10:32 am Post subject: |
|
|
Bullish or Bearish divergence best work when RSI is in the Oversold / Overbought zone... Here RSI has crossed 50 and came back... So I think this should not be effective..
Regards
Ravi
| singh.ravee wrote: | hi,
is it a bullish divergence in bank nifty.
rgds
ravee |
|
|
| Back to top |
|
|
singh.ravee
Yellow Belt
Joined: 12 Aug 2010
Posts: 678
|
| Post: #1453 Posted: Mon Jan 17, 2011 10:36 am Post subject: |
|
|
Ravi_s
thank u so much for ur prompt response on bnf
rgds
ravee
|
|
| Back to top |
|
|
rohit44
White Belt
Joined: 05 Jan 2010
Posts: 279
|
| Post: #1454 Posted: Mon Jan 17, 2011 10:23 pm Post subject: |
|
|
| Can someone will tell about hindalco movement with charts, i like to create a short position, i m newbie and non technical...learning something from you all guys.....RGDS
|
|
| Back to top |
|
|
singh.ravee
Yellow Belt
Joined: 12 Aug 2010
Posts: 678
|
| Post: #1455 Posted: Tue Jan 18, 2011 8:44 am Post subject: |
|
|
Hindalco cmp= 224.85
50 ema support is negotiating with price. monthly pivot point support = 220. In short this zone of 220-225 may provide a good support to the stock as of now.
If u wish to go short then below 220 will offer good opportunity.
thanks and regards
ravee
|
|
| Back to top |
|
|
|
|
You cannot post new topics in this forum
You cannot reply to topics in this forum
You cannot edit your posts in this forum
You cannot delete your posts in this forum
You cannot vote in polls in this forum
You can attach files in this forum
You can download files in this forum
|
Powered by phpBB © 2001, 2005 phpBB Group
|
|
|


