|
|
| View previous topic :: View next topic |
| Author |
a layman's approach to break out and break down |
casper
Green Belt

Joined: 02 Oct 2010
Posts: 1315
|
Post: #1471  Posted: Thu Jan 20, 2011 10:52 am Post subject: Posted: Thu Jan 20, 2011 10:52 am Post subject: |
 |
|
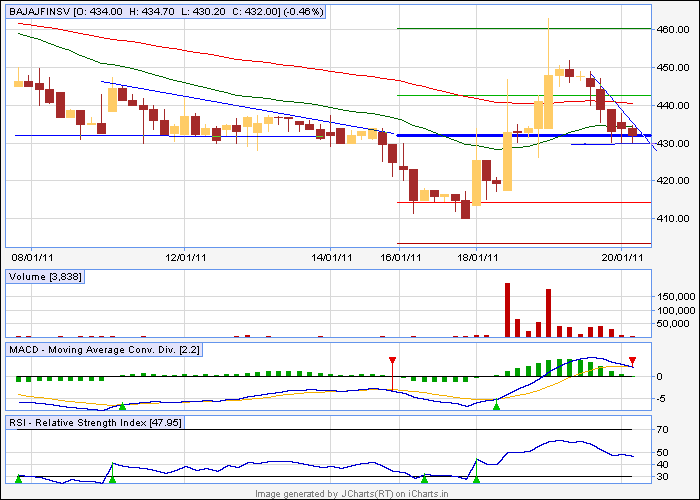
bajaj finsv
making a dt and lower tl is just belowe the weekly pivot, lower tl is 430,waiting to sell it on break down for 420.410,
my sl will be a close above bd level after the break down
| Description: |
|
| Filesize: |
11.36 KB |
| Viewed: |
710 Time(s) |
|
|
|
| Back to top |
|
 |
|
| |
casper
Green Belt
Joined: 02 Oct 2010
Posts: 1315
|
| Post: #1472 Posted: Thu Jan 20, 2011 10:53 am Post subject: |
|
|
| vishytns wrote: | welcome back casperji.....
Waiting for your calls...  |
 annaji.... annaji....
|
|
| Back to top |
|
|
deepakms
White Belt

Joined: 13 Aug 2009
Posts: 194
|
| Post: #1473 Posted: Thu Jan 20, 2011 11:22 am Post subject: |
|
|
Hi Casper , Welcome Back ..........................
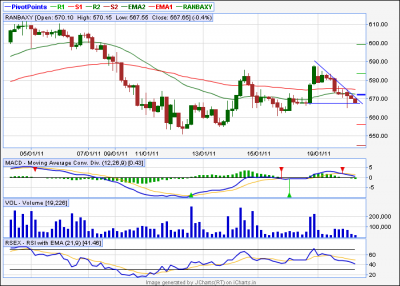
Here is the Ranbaxy chart 60min Tf,ur view pls
thnx/rgds
Deeppak
| Description: |
|
| Filesize: |
25.79 KB |
| Viewed: |
117 Time(s) |
|
|
|
| Back to top |
|
|
casper
Green Belt
Joined: 02 Oct 2010
Posts: 1315
|
| Post: #1474 Posted: Thu Jan 20, 2011 11:41 am Post subject: |
|
|
| singh.ravee wrote: | Casper good morning,
nice to know that u r well and ready to rock again.
last 2 days i m working only on 60min tf in nifty and banknifty. didn't get any opportunity to trade.
Is it normal? means sitting 2 days in front of lappy and still not able to press f1 or f2.
thanks and regards
ravee |
hi ravee good morning, sorry for late reply
in thses days check 5 min charts also for divergence, u know day before yesterday, when nifty bounced back and closed higher, there was very strong - div in 5 min tf
i saw it casually and thought " tomorrow a gap up and going down" and remember what we had in morning
then again yesterday i saw an at broken out in nifty 60 min but could not go up due to weekly piv and 34 ema resi and holding the bo level, i told it vishy, but he said it will go down and very severely it will go down, i think he saw some div and shorted as well and then see what we had during afternoon
i did not saw that div in nifty as i was following that AT
in this market, we still have some opportunity left for us but we have to be very very active and and every time market is doing some thing, we should consider almost all these facts and then trade
if any body got a super brain then he will win every time, but we dont hv that, for example - now divergence is playing, u may remember a few days ago, i got my stops hit while playing wid divergence
so in this market i am really very confused as i am yet to discover how to master this kinds of situation
take my post of bajafinsv, we have + div in 5 min chart, so i know it will go up before actual bd, but if it ever breaks down, then only we can sell
so i am really dont know how to tackle this kinds of situation
i have not experienced this scenario ever
but one thing is clear to me, we are in a down trend, and we are yet to find the bottom. we have no buyer at higher level and all are using higher levels to sell only
if i hv some holdings, when price will come near my buy price i will book it bcoz now i am frightened- this become common psychology now
and if we dont go higher and in the mean time we get another round of bad news then i am sure all will start panic selling at these levels also to save what ever they can, and then, widout any buyer, we will see even lower level ,
so going by this i will search for - div whenever stock/index closes high and we have another fact also
big boys will buy in dips slowly, this will be manifested in + div, so whenever i see market is making new low, i will watch out for + div to see some pullbacks, remember ravee, only pull backs, no bull run, for a day only or may be , for a few hours, then again going down
i think this will continue unless we get some good support,
|
|
| Back to top |
|
|
casper
Green Belt
Joined: 02 Oct 2010
Posts: 1315
|
| Post: #1475 Posted: Thu Jan 20, 2011 11:46 am Post subject: |
|
|
| deepakms wrote: | Hi Casper , Welcome Back ..........................
Here is the Ranbaxy chart 60min Tf,ur view pls
thnx/rgds
Deeppak |
if the current candle closes below bd level then i think we can sell it for 554
|
|
| Back to top |
|
|
deepakms
White Belt
Joined: 13 Aug 2009
Posts: 194
|
| Post: #1476 Posted: Thu Jan 20, 2011 11:47 am Post subject: |
|
|
Casper bhai......Ranbaxy pls ,posted the chart ......looks like u missed it.
deeppak
|
|
| Back to top |
|
|
casper
Green Belt
Joined: 02 Oct 2010
Posts: 1315
|
| Post: #1477 Posted: Thu Jan 20, 2011 11:52 am Post subject: |
|
|
| deepakms wrote: | Casper bhai......Ranbaxy pls ,posted the chart ......looks like u missed it.
deeppak |
replied brother
if the current candle closes below the bd level, which is 565 in cash, we can sell it for 554 aprx which is monthly support in my basic chart
|
|
| Back to top |
|
|
singh.ravee
Yellow Belt

Joined: 12 Aug 2010
Posts: 678
|
| Post: #1478 Posted: Thu Jan 20, 2011 8:36 pm Post subject: |
|
|
casper hello,
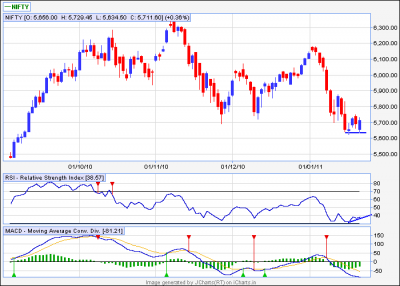
1. is it a bullish divergence in nifty eod charts.
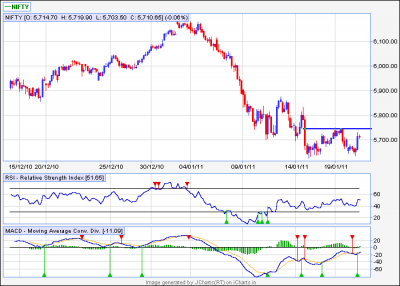
2. is it double bottom( still under formation) in nifty 60min charts. neckline lies just above weekly pivot point.
i will take long only if nifty moves above weekly pivot point is 60min.
then sl= 5630;
tgt= monthly pivot point S1= 38.2% retracement of current move= 5850.
kindly comment as and when possible.
take good care of your health first.
thanks and regards
ravee
| Description: |
|
| Filesize: |
13.4 KB |
| Viewed: |
130 Time(s) |
|
| Description: |
|
| Filesize: |
11.75 KB |
| Viewed: |
119 Time(s) |
|
|
|
| Back to top |
|
|
newinvestor
White Belt
Joined: 16 Feb 2010
Posts: 120
|
| Post: #1479 Posted: Thu Jan 20, 2011 8:48 pm Post subject: |
|
|
Hi Casper. Was away from Trading and the Computer for a few . Now on checking the posts, find that you were unwell. May the Almighty keep you in the best of health always.
Noted about watching the 5 min TF also these days.
Strangely, an AT was there in Nifty 5 min yesterday , but the breakout was downwards.
Today, a DT was there in 5 min, but the breakout happened upwards.
Nifty came down a few points below the DT support, and then zoomed up.
What am I missing? Can MACD and RSI help here? Any MA crossovers can help?
What can be a good trading signal to catch the big intraday moves that keep happening these days?
Take care of your health.
Also, at the closing today, there is a - Div in 5 min TF and + div in 60 min TF.
How to trade this?
|
|
| Back to top |
|
|
singh.ravee
Yellow Belt
Joined: 12 Aug 2010
Posts: 678
|
| Post: #1480 Posted: Thu Jan 20, 2011 9:14 pm Post subject: |
|
|
casper bhai,
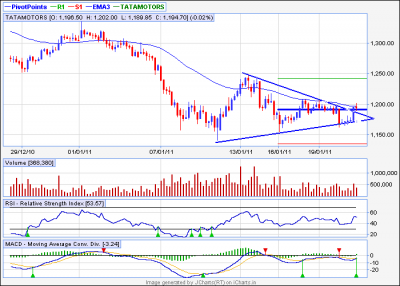
is it symmetrical triangle breakout in tatamotrs 60min chart. Price is currently negotiating with 50ema as well as weekly pivot point.
since u r not in mkt following seems to be working;
buy only above 1200;
sl= tip of triangle = 1180
tgt= i dont know how to calculate, still feel 1250 as first tgt.
kindly comment as and when possible.
rgds
ravee
| Description: |
|
| Filesize: |
13.27 KB |
| Viewed: |
133 Time(s) |
|
|
|
| Back to top |
|
|
Ravi_S
Yellow Belt
Joined: 15 Jun 2009
Posts: 569
|
| Post: #1481 Posted: Thu Jan 20, 2011 10:38 pm Post subject: |
|
|
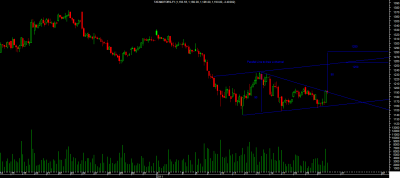
singh.ravee...
Please see the chart attached. Tata Motors if it breaks the triangle convincingly, then the first target would be the channel target which would be anywhere between 1250 and 1270 depending on where it touches the channel line. The Ascending triangle target is around 1280. The target is calculated as shown.
Regards
Ravi
| singh.ravee wrote: | casper bhai,
is it symmetrical triangle breakout in tatamotrs 60min chart. Price is currently negotiating with 50ema as well as weekly pivot point.
since u r not in mkt following seems to be working;
buy only above 1200;
sl= tip of triangle = 1180
tgt= i dont know how to calculate, still feel 1250 as first tgt.
kindly comment as and when possible.
rgds
ravee |
| Description: |
|
| Filesize: |
20.67 KB |
| Viewed: |
153 Time(s) |
|
|
|
| Back to top |
|
|
casper
Green Belt
Joined: 02 Oct 2010
Posts: 1315
|
| Post: #1482 Posted: Thu Jan 20, 2011 11:25 pm Post subject: |
|
|
| singh.ravee wrote: | casper hello,
1. is it a bullish divergence in nifty eod charts.
2. is it double bottom( still under formation) in nifty 60min charts. neckline lies just above weekly pivot point.
i will take long only if nifty moves above weekly pivot point is 60min.
then sl= 5630;
tgt= monthly pivot point S1= 38.2% retracement of current move= 5850.
kindly comment as and when possible.
take good care of your health first.
thanks and regards
ravee |
hi brother
yes it is + div in daily nifty and double bottom is forming in 60 min
in case of double bottom bo, it will not only break the double bottom resi but also will break weekly pivots
so i expect great volatility there, just like our regular break outs, here, after bo, i will buy with a sl below weekly pivot only
u know if by any reason price get back below pivot after a break out, then it will start oscillating between weekly piv and 5630, so personally i dont want to be trapped there
so i will use a 60 min candle close below weekly pivot as my sl
|
|
| Back to top |
|
|
casper
Green Belt
Joined: 02 Oct 2010
Posts: 1315
|
| Post: #1483 Posted: Thu Jan 20, 2011 11:58 pm Post subject: |
|
|
| newinvestor wrote: | Hi Casper. Was away from Trading and the Computer for a few . Now on checking the posts, find that you were unwell. May the Almighty keep you in the best of health always.
Noted about watching the 5 min TF also these days.
Strangely, an AT was there in Nifty 5 min yesterday , but the breakout was downwards.
Today, a DT was there in 5 min, but the breakout happened upwards.
Nifty came down a few points below the DT support, and then zoomed up.
What am I missing? Can MACD and RSI help here? Any MA crossovers can help?
What can be a good trading signal to catch the big intraday moves that keep happening these days?
Take care of your health.
Also, at the closing today, there is a - Div in 5 min TF and + div in 60 min TF.
How to trade this? |
hi newinvestor,
its nice to see u back again
now i am almost okey, i will reply u in details only after going through the charts in morning, but for now i am replying ur last question, which seems to me more urgent one
in case of - div in 5 min and + div in 60min chart , i hv seen that price tends to open with a gap up and then falls violently within 30-45 min
then after that it starts bottoming out and closes after giving strong up move due to + div in higher tf
this was the case of hdfc and ongc,
now i expect it to repeat the same tomorrow, i expect nifty to go up and then come down, (even due to global ques it may gap down and go down straightly) but within 1st hour itself, i expect it to bottom out and make new highs
|
|
| Back to top |
|
|
drsureshbs
White Belt
Joined: 22 Oct 2008
Posts: 58
|
| Post: #1484 Posted: Fri Jan 21, 2011 12:10 am Post subject: |
|
|
Dear casper nice to know u r fine
Axis bank 5min tf i think it has formed h&s, AT.C&S on20th CAN U pl mark entris on graph with sl .IF TRADED a good trade .pl bear with me i d0nt know h0w to post a chart
|
|
| Back to top |
|
|
singh.ravee
Yellow Belt
Joined: 12 Aug 2010
Posts: 678
|
| Post: #1485 Posted: Fri Jan 21, 2011 8:48 am Post subject: |
|
|
Ravi_S,
good morning,
thank you so much for your reply and telling me how to calculate tgt of symmetrical triangle.
it would be nice on your part, if you can share your views of "if breaks convincingly".
For big targets i use a price which is 1% above the breakout level.
rgds
ravee
|
|
| Back to top |
|
|
|
|
You cannot post new topics in this forum
You cannot reply to topics in this forum
You cannot edit your posts in this forum
You cannot delete your posts in this forum
You cannot vote in polls in this forum
You can attach files in this forum
You can download files in this forum
|
Powered by phpBB © 2001, 2005 phpBB Group
|
|
|


