|
|
| View previous topic :: View next topic |
| Author |
a layman's approach to break out and break down |
singh.ravee
Yellow Belt

Joined: 12 Aug 2010
Posts: 678
|
Post: #1486  Posted: Fri Jan 21, 2011 8:50 am Post subject: Posted: Fri Jan 21, 2011 8:50 am Post subject: |
 |
|
casper hello,
hope u r fine.
kindly explain "volatility around pivot point" a bit more as and when possible
thnx n rgds
ravee
|
|
| Back to top |
|
 |
|
| |
casper
Green Belt

Joined: 02 Oct 2010
Posts: 1315
|
| Post: #1487 Posted: Fri Jan 21, 2011 9:09 am Post subject: |
|
|
| drsureshbs wrote: | Dear casper nice to know u r fine
Axis bank 5min tf i think it has formed h&s, AT.C&S on20th CAN U pl mark entris on graph with sl .IF TRADED a good trade .pl bear with me i d0nt know h0w to post a chart |
hiii drsureshbs
nice to see u back tooo!!!! where were u all these days? u must be very busy wid ur profession , naa?

ok, lets jump to the axis chart
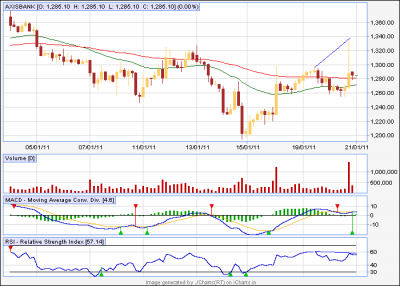
1. i saw a c/h like pattern, but not c/h in axisbank 5 min tf, the handle part did not started from the bo lvel, it should be a correction from bo level to make this handle, here it did not reach that level and started falling to make a loop like structure
in my chart, i have marked the designated level by an arrow, if this loop started from there, then only we could call it c/h
2. and the h/s formation i found in the chart is also not proper h/s as both shoulder lacks symmetry, i am not talking about the heights only, but an overall symmetry, a lil difference in height and base is not a problem, but that shld be more symmetrical
and i could not found at here
finally, i am posting how i see axisbank, see yesterday in 60 min tf, it has made a higher high in price, but corresponding rsi made lower, high, showing weakness, so i expect it to come down,
| Description: |
|
| Filesize: |
13.12 KB |
| Viewed: |
148 Time(s) |
|
| Description: |
|
| Filesize: |
31.98 KB |
| Viewed: |
134 Time(s) |
|
| Description: |
|
| Filesize: |
13.65 KB |
| Viewed: |
122 Time(s) |
|
|
|
| Back to top |
|
|
casper
Green Belt
Joined: 02 Oct 2010
Posts: 1315
|
| Post: #1488 Posted: Fri Jan 21, 2011 9:44 am Post subject: |
|
|
| singh.ravee wrote: | casper hello,
hope u r fine.
kindly explain "volatility around pivot point" a bit more as and when possible
thnx n rgds
ravee |
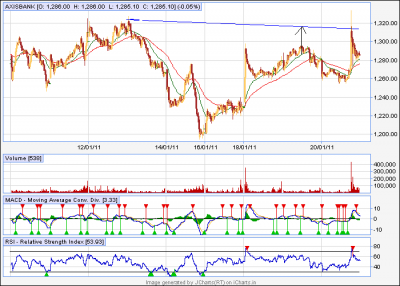
hii ravee, let us count how many resistance we have at that level
1. weekly pivot
2.double bottom resi
3.34 ema
in normal bo cases only, i am sure u have seen if if a bo level comes very near to 34/89 ema or weekly/monthly level, then how strong it becomes and breaking out turns to be hard job
u know a funny thing, i have seen weekly levels to absorb 2-4 hits , on average 3 hits before breaking. for monthly levels, this becomes 4-6 hits , avg 5 hits
as i trade only bo/bd so i have noticed it minutely
so now, here we are to break 3 resi, so now imagine, how strong bo we need?
thats why i said, there will be very high volatility at this time
|
|
| Back to top |
|
|
singh.ravee
Yellow Belt
Joined: 12 Aug 2010
Posts: 678
|
| Post: #1489 Posted: Fri Jan 21, 2011 9:46 am Post subject: |
|
|
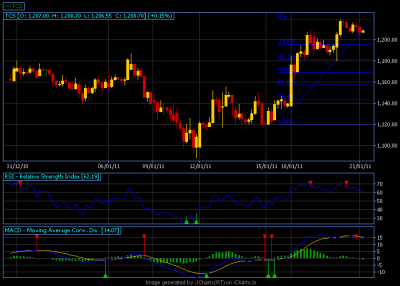
casper,
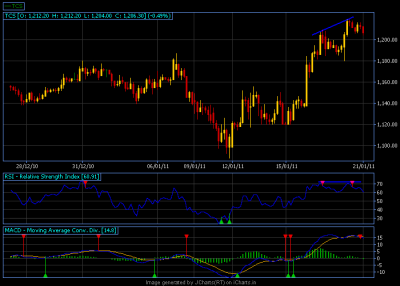
is it bearish divergence in tcs 60min
sl= 1220
cmp= 1205
tgt = dont know how to calculate
rgds
ravee
| Description: |
|
| Filesize: |
12.6 KB |
| Viewed: |
143 Time(s) |
|
|
|
| Back to top |
|
|
Ravi_S
Yellow Belt
Joined: 15 Jun 2009
Posts: 569
|
| Post: #1490 Posted: Fri Jan 21, 2011 9:56 am Post subject: |
|
|
For divergences, it's best to use FIBO and Pivots... First target can be 23.6% of the retracement and then 38.2%. Casper let us knwo if there is any other way in which this can be done?
Regards
Ravi
| singh.ravee wrote: | casper,
is it bearish divergence in tcs 60min
sl= 1220
cmp= 1205
tgt = dont know how to calculate
rgds
ravee |
|
|
| Back to top |
|
|
singh.ravee
Yellow Belt
Joined: 12 Aug 2010
Posts: 678
|
| Post: #1491 Posted: Fri Jan 21, 2011 10:03 am Post subject: |
|
|
Ravi_S,
If i have understood u clearly, then tgt= 1195- 1180 as per attached chart
rgds
ravee
| Description: |
|
| Filesize: |
12.97 KB |
| Viewed: |
201 Time(s) |
|
|
|
| Back to top |
|
|
casper
Green Belt
Joined: 02 Oct 2010
Posts: 1315
|
| Post: #1492 Posted: Fri Jan 21, 2011 10:05 am Post subject: |
|
|
| singh.ravee wrote: | casper,
is it bearish divergence in tcs 60min
sl= 1220
cmp= 1205
tgt = dont know how to calculate
rgds
ravee |
hi i thinks its - div and can come down, even monthly leve is the resistance, where it formed and we can sell with a sl above a close of monthly level
nice finding brother
and a small request
plz post charts in white format, suddenly i hv troubles wid my monitor which is showing all the dark color, black, so in case of black charts, i cant understand ur drawing
|
|
| Back to top |
|
|
Ravi_S
Yellow Belt
Joined: 15 Jun 2009
Posts: 569
|
| Post: #1493 Posted: Fri Jan 21, 2011 11:16 am Post subject: |
|
|
| singh.ravee, look at Tata Motors...
|
|
| Back to top |
|
|
singh.ravee
Yellow Belt
Joined: 12 Aug 2010
Posts: 678
|
| Post: #1494 Posted: Fri Jan 21, 2011 11:22 am Post subject: |
|
|
Ravi bhai,
waiting for tata motors to cross 1200 on 60min to take entry. Price is currently fighting with 35ema, 50ema and weekly pivot point. Lets hope for the best on long side
rgds
ravee
|
|
| Back to top |
|
|
Ravi_S
Yellow Belt
Joined: 15 Jun 2009
Posts: 569
|
| Post: #1495 Posted: Fri Jan 21, 2011 7:11 pm Post subject: |
|
|
Ravee... Yur wait paid off today... otherwise 
[quote="singh.ravee"]Ravi bhai,
waiting for tata motors to cross 1200 on 60min to take entry. Price is currently fighting with 35ema, 50ema and weekly pivot point. Lets hope for the best on long side
rgds
ravee[/quote
|
|
| Back to top |
|
|
singh.ravee
Yellow Belt
Joined: 12 Aug 2010
Posts: 678
|
| Post: #1496 Posted: Fri Jan 21, 2011 8:59 pm Post subject: |
|
|
Ravi,
aaj to baal baal bach gaya tata motors mein. 
par aadat se majboor, isliye kahin to fasna tha. tcs short kar diya 
position is still open, lets c what happens on monday.
rgds
|
|
| Back to top |
|
|
chrome
Yellow Belt
Joined: 28 Dec 2009
Posts: 645
|
| Post: #1497 Posted: Fri Jan 21, 2011 10:11 pm Post subject: |
|
|
got badly burnt in tatamotors long today..got more badly hurt as i put sl as 1884 instead of 1184 
|
|
| Back to top |
|
|
popoy
White Belt

Joined: 18 Sep 2010
Posts: 18
|
| Post: #1498 Posted: Sat Jan 22, 2011 7:19 am Post subject: |
|
|
| chrome wrote: | | got badly burnt in tatamotors long today..got more badly hurt as i put sl as 1884 instead of 1184 |
chrome sir i too made mistake..... typed 190 insted of 290......... but that ordeer rejected ...... bach gaya mene
|
|
| Back to top |
|
|
girishhu1
White Belt
Joined: 17 Aug 2009
Posts: 316
|
| Post: #1499 Posted: Sat Jan 22, 2011 11:30 am Post subject: |
|
|
hellow casperji,
just returned from vacation. wish you speedy recovery from fever.
kindly comment on bank of india and lic hsg finance. both have broken out of downward sloping trendline on eod alongwith volume . on hourly time frame both have broken out of at and almost reached target of at.rsi is in overbought level on hourly. what should be our strategy for intraday trading? short for a little correction or wait for small correction and then buy at 34 ema level. please note that both stocks, as per stockglance, are in bearish mode in medium (21 days)and long term (63 days ) basis and bullish on short term basis(5 day) . in fact the 5 day increase for both stocks is in the range of 15-30%. i think if stock closes above 201 and remains there for 1/2 days on closing basis then bottom formation is complete in case of lic hsg fin.
waiting for your reply.
regards,
girish
|
|
| Back to top |
|
|
singh.ravee
Yellow Belt
Joined: 12 Aug 2010
Posts: 678
|
| Post: #1500 Posted: Sat Jan 22, 2011 5:32 pm Post subject: |
|
|
casper hello,
Do u remember the bank nifty explaination of sherbaaz? Wasn't that wonderful. Last two days i read entire book of steve nison on candlesticks.
I felt that in a hurry to trade, we forget the basics of our trading system and get caught. Lots of question enter into our mind as to what is sl, tgt, entry point and etc etc. In this process we miss major trading opportunities that lies in front of us. Case in point would be shorting nifty around 6100 levels after an evening star appeared there. Then we end up everyday coveting for rides on nifty and many a times get trapped.
The biggest challenge before a trader is to keep his trading system simple. Time and again bad habits of a trader push him towards complicated ways of stock assessment and subsequent trading.
Just sharing my views with you after revisiting steve nison's book.
thanks and regards
ravee.
|
|
| Back to top |
|
|
|
|
You cannot post new topics in this forum
You cannot reply to topics in this forum
You cannot edit your posts in this forum
You cannot delete your posts in this forum
You cannot vote in polls in this forum
You can attach files in this forum
You can download files in this forum
|
Powered by phpBB © 2001, 2005 phpBB Group
|
|
|


