|
|
| View previous topic :: View next topic |
| Author |
a layman's approach to break out and break down |
casper
Green Belt

Joined: 02 Oct 2010
Posts: 1315
|
Post: #16  Posted: Fri Oct 22, 2010 5:47 pm Post subject: Posted: Fri Oct 22, 2010 5:47 pm Post subject: |
 |
|
thank u rashmi, meghamehra, and mithu2 for ur encouragements.  , ,
here is the reply,
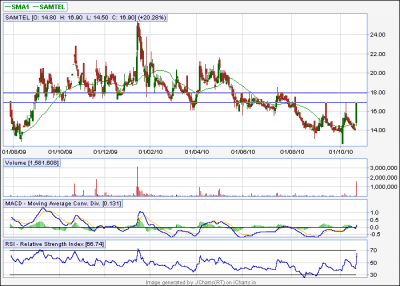
samtel had a resistance at 18,which it cleared today, now i think it may go up to 20 at least,
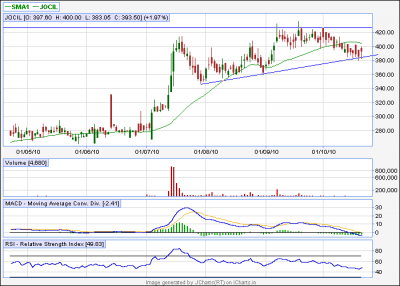
jocil: a trend line support, along with a lower bollinger band is around 380, and this is going to be one of the strongest support, so u can use it as ur stoploss by closing basis, after taking this support, suppose this stock closes above 428 in coming days (which is very likely) then we will get an ascending triangle and then, i think road up to 460 would be clear,
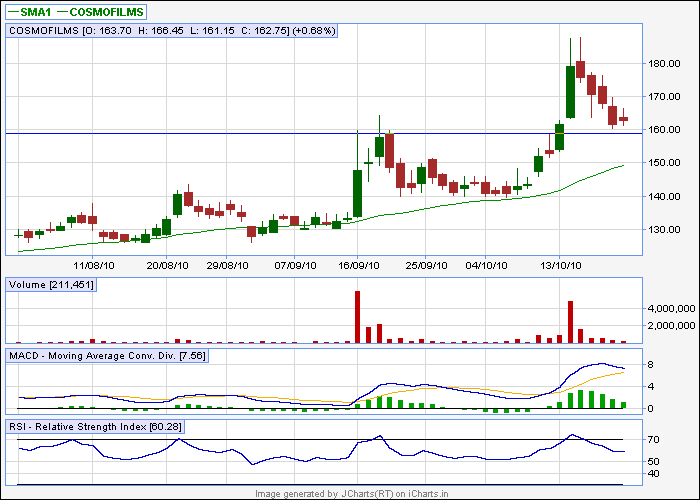
cosmo films; it looks like a round bottom, not proper cup and handle, and follow the price, u will find that after breaking out, the price is coming back to test the bo level, i think it may consolidated a lil at this bo level and this level may be used as stop loss
( i hv attached the charts, but none of them r updated yet)
ps: last but not least, earnings season is on, market will surely act like a bit of roller coaster, so please be careful and update ur holdings daily
| Description: |
|
| Filesize: |
10.91 KB |
| Viewed: |
4667 Time(s) |
|
| Description: |
|
| Filesize: |
15.87 KB |
| Viewed: |
697 Time(s) |
|
| Description: |
|
| Filesize: |
12.2 KB |
| Viewed: |
677 Time(s) |
|
|
|
| Back to top |
|
 |
|
| |
casper
Green Belt
Joined: 02 Oct 2010
Posts: 1315
|
| Post: #17 Posted: Fri Oct 22, 2010 6:27 pm Post subject: |
|
|
Cup with Handle (Continuation)
the Cup with Handle is a bullish continuation pattern that marks a consolidation period followed by a breakout. It was developed by William O'Neil
As its name implies, there are two parts to the pattern: the cup and the handle. The cup forms after an advance and looks like a bowl or rounding bottom. As the cup is completed, a trading range develops on the right hand side and the handle is formed. A subsequent breakout from the handle's trading range signals a continuation of the prior advance.
IMORTANT ASPECTS
1. Trend: To qualify as a continuation pattern, a prior trend should exist. Ideally, the trend should be a few months old and not too mature. The more mature the trend, the less chance that the pattern marks a continuation or the less upside potential.
2. Cup: The cup should be "U" shaped and resemble a bowl or rounding bottom. A "V" shaped bottom would be considered too sharp of a reversal to qualify. The softer "U" shape ensures that the cup is a consolidation pattern with valid support at the bottom of the "U". The perfect pattern would have equal highs on both sides of the cup, but this is not always the case.
3. Cup Depth: Ideally, the depth of the cup should retrace 1/3 or less of the previous advance. However, with volatile markets and over-reactions, the retracement could range from 1/3 to 1/2. In extreme situations, the maximum retracement could be 2/3, which is conforms with Dow Theory.
4. Handle: After the high forms on the right side of the cup, there is a pullback that forms the handle. Sometimes this handle resembles a flag or pennant that slopes downward, other times just a short pullback. The handle represents the final consolidation/pullback before the big breakout and can retrace up to 1/3 of the cup's advance, but usually not more. The smaller the retracement is, the more bullish the formation and significant the breakout. Sometimes it is prudent to wait for a break above the resistance line established by the highs of the cup.
5. Duration: The cup can extend from 1 to 6 months, sometimes longer on weekly charts. The handle can be from 1 week to many weeks and ideally completes within 1-4 weeks.
6. Volume: There should be a substantial increase in volume on the breakout above the handle's resistance.
7. Target: The projected advance after breakout can be estimated by measuring the distance from the right peak of the cup to the bottom of the cup.
As with most chart patterns, it is more important to capture the essence of the pattern than the particulars. The cup is a bowl-shaped consolidation and the handle is a short pullback followed by a breakout with expanding volume. A cup retracement of 62% may not fit the pattern requirements, but a particular stock's pattern may still capture the essence of the Cup with Handle
Rashmi: in ur example of cosmo films, I mentioned that it is not proper cup and handle yet, now u can see the thing, ideally after the consolidation its now experiencing, it will give another bo and then only the round bottom pattern of cosmo films will qualify as a proper cup and handle
| Description: |
|
| Filesize: |
16.84 KB |
| Viewed: |
778 Time(s) |
|
|
|
| Back to top |
|
|
drsureshbs
White Belt

Joined: 22 Oct 2008
Posts: 58
|
| Post: #18 Posted: Sat Oct 23, 2010 1:14 am Post subject: |
|
|
| Hi ,Good and informative.Keep up posting.Small quiry. what is the ideal parameter for boligar band ur advise will b apprciated .thanks
|
|
| Back to top |
|
|
casper
Green Belt
Joined: 02 Oct 2010
Posts: 1315
|
| Post: #19 Posted: Sat Oct 23, 2010 9:13 am Post subject: |
|
|
drsureshbs, thank for ur comments,
i normally use 20,2 setting which is the default for i chart, its quite helpful for positional trades as the upper and lower band generally act like strongest resistance and support respectively on eod basis,
but at times of higher volatility, specially after a break down, u will see this 20,2 band has got quite expanded which may result heavy whip shaw, in such a situation, i switch over to bollinger band (9) setting, which is default of jchart eod, and i have found its quite useful as it will filter the large expansion of 20,2 bb and will produce more fine results,
and if u r an obligatory day trader (!!!) like me,( my motto is - i will gamble my today, and trust my tomorrow...... just joking ) u will better use bollinger band 9 setting of j chart eod, very very useful i must say, but be careful, nothing is going to be a holy grail anyway
|
|
| Back to top |
|
|
ragarwal
Yellow Belt

Joined: 16 Nov 2008
Posts: 582
|
| Post: #20 Posted: Sat Oct 23, 2010 11:31 am Post subject: |
|
|
dear casper thnks fr the reply.ur posts r very informative and a big help fr ppl like us.regarding abg ship if v consider the breakout then the trget seems to b a gud 200 point upmove frm the breakout zone,which is 250.considering tht d stock moved up a 100 rs is there 100 more to go,so cn v enter into this one now.also one more thing,if a stock completes its breakout trget ,then shud it b exited or it cn go on making higher trgets,wid some consolidation.
warm regds rashmi
|
|
| Back to top |
|
|
casper
Green Belt
Joined: 02 Oct 2010
Posts: 1315
|
| Post: #21 Posted: Sat Oct 23, 2010 5:39 pm Post subject: |
|
|
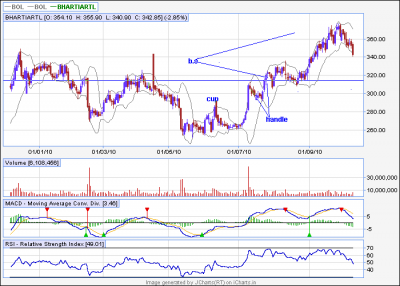
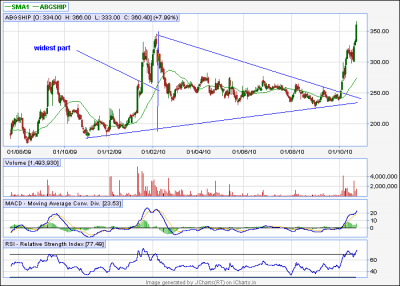
abgship break out target would be around 150, not 200, u have to draw a perpendicular from the top which shuld intersect the lower tl, do it and u will have 150, (top is 350 minus lower tl 200), now target is 250 (bo point)+150=400, so we can hold it upto 400 atleast,
and any bo target is minimum target, meaning the price should reach up to that AT LEAST, (given a favorable market condition), in practice we generally see the price exceeds the target, but may pause for a brief consolidation at the target area, using a trailing stop to move on with the price is best idea here
{i am attaching abgship again to show u how to measure a target by measuring the widest part}
| Description: |
|
| Filesize: |
16.51 KB |
| Viewed: |
831 Time(s) |
|
|
|
| Back to top |
|
|
casper
Green Belt
Joined: 02 Oct 2010
Posts: 1315
|
| Post: #22 Posted: Sat Oct 23, 2010 6:00 pm Post subject: |
|
|
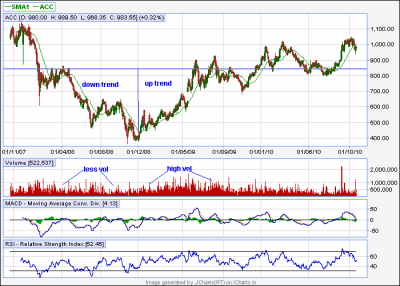
Rounding Bottom (Reversal)
The rounding bottom is a long-term reversal pattern that is best suited for weekly charts. It is also referred to as a saucer bottom, and represents a long consolidation period that turns from a bearish bias to a bullish bias
IMORTANT ASPECTS
1. Prior Trend: In order to be a reversal pattern, there must be a prior trend to reverse. Ideally, the low of a rounding bottom will mark a new low or reaction low. In practice, there are occasions when the low is recorded many months earlier and the security trades flat before forming the pattern. When the rounding bottom does finally form, its low may not be the lowest low of the last few months.
2. Decline: The first portion of the rounding bottom is the decline that leads to the low of the pattern. This decline can take on different forms: some are quite jagged with a number of reaction highs and lows, while others trade lower in a more linear fashion.
3. Low: The low of the rounding bottom can resemble a "V' bottom, but should not be too sharp and should take a few weeks to form. Because prices are in a long-term decline, the possibility of a selling climax exists that could create a lower spike.
4. Advance: The advance off of the lows forms the right half of the pattern and should take about the same amount of time as the prior decline. If the advance is too sharp, then the validity of a rounding bottom may be in question.
5. Breakout: Bullish confirmation comes when the pattern breaks above the reaction high that marked the beginning of the decline at the start of the pattern. As with most resistance breakouts, this level can become support. However, rounding bottoms represent long-term reversal and this new support level may not be that significant.
6. Volume: In an ideal pattern, volume levels will track the shape of the rounding bottom: high at the beginning of the decline, low at the end of the decline and rising during the advance. Volume levels are not too important on the decline, but there should be an increase in volume on the advance and preferably on the breakout.
A rounding bottom could be thought of as an inverse head and shoulders bottom without readily identifiable shoulders. The head represents the low and is fairly central to the pattern. The volume patterns are similar and confirmation comes with a resistance breakout. While symmetry is preferable on the rounding bottom, the left and right side do not have to be equal in time or slope. The important thing is to capture the essence of the pattern.
| Description: |
|
| Filesize: |
18.93 KB |
| Viewed: |
715 Time(s) |
|
|
|
| Back to top |
|
|
girishhu1
White Belt
Joined: 17 Aug 2009
Posts: 316
|
| Post: #23 Posted: Sun Oct 24, 2010 8:42 am Post subject: |
|
|
casperji,
what should be the target and period to achieve the target? also what is average period for formation of the rounding bottom pattern?
|
|
| Back to top |
|
|
casper
Green Belt
Joined: 02 Oct 2010
Posts: 1315
|
| Post: #24 Posted: Sun Oct 24, 2010 9:55 am Post subject: |
|
|
its a long consolidation pattern,which may be the investor"s delight, this long consolidation phase implies a huge accumulation by the informed investors,(strong hands... as they say)
the time frame varies heavily, it may take at least 4 weeks to several years,where longer the time frame,higher the breakout,
a pattern forming within 3 weeks or below may be doubtful
for target, measure the distance from the right top and the lowest low and project it upward from the bo point,
however in practice it is seen that the price may move in a liner fashion for another week or so before resuming the upward move at 45-60 degree slope, (unlike other patterns where price zooms after the bo in almost straight ways)
its more of an investor's pattern, than that of a traders, so it takes time to reach target also
|
|
| Back to top |
|
|
drsureshbs
White Belt
Joined: 22 Oct 2008
Posts: 58
|
| Post: #25 Posted: Sun Oct 24, 2010 3:09 pm Post subject: |
|
|
| Thanks . Casper fof ur eloborate reply. I usually take positional trade,since i cant day trade bcoz of my profession. U deserve all appriciatoin for sparig so much time for others. CAN U THRO SOME LIGHT ON CANDDLE PATTREN SUGGESTING ACCUMLATIION. Ur respons will b apprciated.
|
|
| Back to top |
|
|
casper
Green Belt
Joined: 02 Oct 2010
Posts: 1315
|
| Post: #26 Posted: Sun Oct 24, 2010 3:58 pm Post subject: |
|
|
hi drsureshsbs, thanks for ur kind comments, its the supports and encouragements from ppls like u which help me to share whatever lil bit i understood about the market,
there is not much candlestick patterns which could be used as accumulation patterns,the strongest patterns are REVERSAL PATTERNS.
and they are quite hard to find on chart in their proper forms also, but still strongest but not so rare patterns are morning star (bear to bull) and evening star (bull to bear) reversal patterns,
a lot of things can be said about these patterns but in a nutshell, a bull to bear pattern occurring at a strong resistance as well as a bear to bull reversal pattern forming at a strong support, increases the validity of the signals considerably.
i am attaching an e.book, once upon a time, i downloaded it from i chart forum.(im sorry i forget who actually uploaded it,any ways the credit of sharing goes definitely to him/her)
it helped me to improve my trading style heavily, please go through this, im sure u will find it so precious, and afterwards, if u hv any questions.... feel free to ask,
| Description: |
|

Download |
| Filename: |
glossary_of_candle_stick_signals_523.pdf |
| Filesize: |
744.63 KB |
| Downloaded: |
1029 Time(s) |
|
|
| Back to top |
|
|
girishhu1
White Belt
Joined: 17 Aug 2009
Posts: 316
|
| Post: #27 Posted: Mon Oct 25, 2010 7:05 am Post subject: |
|
|
thanks, casperji. 
|
|
| Back to top |
|
|
casper
Green Belt
Joined: 02 Oct 2010
Posts: 1315
|
| Post: #28 Posted: Mon Oct 25, 2010 8:37 am Post subject: |
|
|
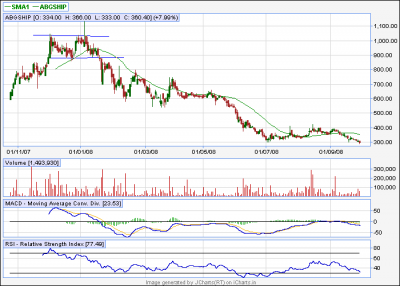
Double Top (Reversal)
The double top is a major reversal pattern that forms after an extended uptrend. As its name implies, the pattern is made up of two consecutive peaks that are roughly equal, with a moderate trough in-between.
Although there can be variations, the classic double top marks at least an intermediate change, if not long-term change, in trend from bullish to bearish. Many potential double tops can form along the way up, but until key support is broken, a reversal cannot be confirmed.
IMOPRTANT FEATURES.
1. Prior Trend: With any reversal pattern, there must be an existing trend to reverse. In the case of the double top, a significant uptrend of several months should be in place.
2. First Peak: The first peak should mark the highest point of the current trend. As such, the first peak is fairly normal and the uptrend is not in jeopardy (or in question) at this time.
3. Trough: After the first peak, a decline takes place that typically ranges from 10 to 20%. Volume on the decline from the first peak is usually inconsequential. The lows are sometimes rounded or drawn out a bit, which can be a sign of tepid demand.
4. Second Peak: The advance off the lows usually occurs with low volume and meets resistance from the previous high. Even after meeting resistance, only the possibility of a double top exists. The pattern still needs to be confirmed. The time period between peaks can vary from a few weeks to many months, with the norm being 1-3 months. While exact peaks are preferable, there is some leeway. Usually a peak within 3% of the previous high is adequate.
5. Decline from Peak: The subsequent decline from the second peak should witness an expansion in volume and/or an accelerated descent, may be marked with a gap or two. Such a decline shows that the forces of demand are weaker than supply and a support test is imminent.
6. Support Break: Even after trading down to support, the double top and trend reversal are still not complete. Breaking support from the lowest point between the peaks completes the double top. This too should occur with an increase in volume and/or an accelerated descent.
7. Support Turned Resistance: Broken support becomes potential resistance and there is sometimes a test of this newfound resistance level with a reaction rally. Such a test can offer a second chance to exit a position or initiate a short.
8. Price Target: The distance from support break to peak can be subtracted from the support break for a price target. This would infer that the bigger the formation is, the larger the potential decline.
While the double top formation may seem straightforward, technicians should take proper steps to avoid deceptive double tops. The peaks should be separated by about a month. If the peaks are too close, they could just represent normal resistance rather than a lasting change in the supply/demand picture. Ensure that the low between the peaks declines at least 10%. Declines less than 10% may not be indicative of a significant increase in selling pressure. After the decline, analyze the trough for clues on the strength of demand. If the trough drags on a bit and has trouble moving back up, demand could be drying up. When the security does advance, look for a contraction in volume as a further indication of weakening demand.
Perhaps the most important aspect of a double top is to avoid jumping the gun. WAIT FOR SUPPORT TO BE BROKEN IN A CONVINCING MANNER, and usually with an expansion of volume. A price or time filter can be applied to differentiate between valid and false support breaks. A price filter might require a 3% support break before validation. A time filter might require the support break to hold for 3 days before considering it valid.
| Description: |
|
| Filesize: |
13.45 KB |
| Viewed: |
656 Time(s) |
|
|
|
| Back to top |
|
|
casper
Green Belt
Joined: 02 Oct 2010
Posts: 1315
|
| Post: #29 Posted: Mon Oct 25, 2010 8:59 am Post subject: |
|
|
| girishhu1, thanks and welcome
|
|
| Back to top |
|
|
casper
Green Belt
Joined: 02 Oct 2010
Posts: 1315
|
| Post: #30 Posted: Mon Oct 25, 2010 7:09 pm Post subject: |
|
|
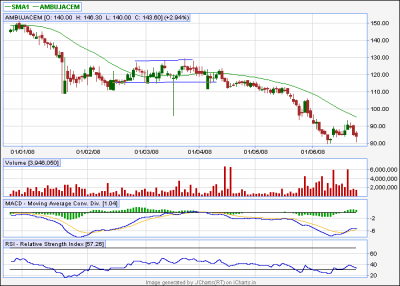
Triple Top (Reversal)
The triple top is a reversal pattern made up of three equal highs followed by a break below support. Triple tops usually form over a shorter time frame and typically range from 3 to 6 months.
IMPORTANT ASPECTS
1. Prior Trend: With any reversal pattern, there should be an existing trend to reverse. In the case of the triple top, an uptrend or long trading range should be in place. Sometimes there will be a definitive uptrend to reverse. Other times the uptrend will fade and become many months of sideways trading.
2. Three Highs: All three highs should be reasonable equal, well spaced and mark significant turning points. The highs do not have to be exactly equal, but should be reasonably equivalent to each other.
3. Volume: As the triple top develops, overall volume levels usually decline. Volume sometimes increases near the highs. After the third high, an expansion of volume on the subsequent decline and at the support break greatly reinforces the soundness of the pattern.
4. Support Break: As with many other reversal patterns, the triple top is not complete until a support break. The lowest point of the formation, which would be the lowest of the intermittent lows, marks this key support level.
5. Support Turns Resistance: Broken support becomes potential resistance, and there is sometimes a test of this newfound resistance level with a subsequent reaction rally.
6. Price Target: The distance from the support break to highs can be measured and subtracted from the support break for a price target. The longer the pattern develops, the more significant is the ultimate break. Triple tops that are 6 or more months old represent major tops and a price target is less likely to be effective.
Throughout the development of the triple top, it can start to resemble a number of patterns. Before the third high forms, the pattern may look like a double top. Three equal highs can also be found in an ascending triangle or rectangle. Of these patterns mentioned, only the ascending triangle has bullish overtones; the others are neutral until a break occurs. In this same vein, the triple top should also be treated as a neutral pattern until a breakdown occurs. The inability to break above resistance is bearish, but the bears have not won the battle until support is broken. Volume on the last decline off resistance can sometimes yield a clue. If there is a sharp increase in volume and momentum, then the chances of a support break increase.
| Description: |
|
| Filesize: |
12.08 KB |
| Viewed: |
652 Time(s) |
|
|
|
| Back to top |
|
|
|
|
You cannot post new topics in this forum
You cannot reply to topics in this forum
You cannot edit your posts in this forum
You cannot delete your posts in this forum
You cannot vote in polls in this forum
You can attach files in this forum
You can download files in this forum
|
Powered by phpBB © 2001, 2005 phpBB Group
|
|
|


