|
|
| View previous topic :: View next topic |
| Author |
a layman's approach to break out and break down |
vishytns
White Belt

Joined: 26 Nov 2009
Posts: 206
|
Post: #151  Posted: Sun Nov 07, 2010 12:44 pm Post subject: Posted: Sun Nov 07, 2010 12:44 pm Post subject: |
 |
|
Casper,
When I started my thread "Chart Patterns" I was not aware of this thread which is more detailed than mine. Since your are covering most of the patterns with more description, I will stop my thread (which i feel will be duplicate) and post all my findings in your thread. I hope you will provide your valuable analysis on my posts. I will help you(encourage) by finding the patterns you are discussing in this thread in some of the stocks and usually track.
Please let me know if I am deviating the objectives of your thread.
encouraging you and your technical analysis.
Vishwanath
|
|
| Back to top |
|
 |
|
|  |
casper
Green Belt

Joined: 02 Oct 2010
Posts: 1315
|
Post: #152  Posted: Sun Nov 07, 2010 1:24 pm Post subject: Posted: Sun Nov 07, 2010 1:24 pm Post subject: |
 |
|

u r welcome brother, plz feel free to post as well as share ur views also, from my side, im always ready to help u wid whatever lil bit i understand of t.a 
|
|
| Back to top |
|
 |
newinvestor
White Belt

Joined: 16 Feb 2010
Posts: 120
|
Post: #153  Posted: Sun Nov 07, 2010 1:29 pm Post subject: Posted: Sun Nov 07, 2010 1:29 pm Post subject: |
 |
|
| vishytns wrote: | Casper,
When I started my thread "Chart Patterns" I was not aware of this thread which is more detailed than mine. Since your are covering most of the patterns with more description, I will stop my thread (which i feel will be duplicate) and post all my findings in your thread. I hope you will provide your valuable analysis on my posts. I will help you(encourage) by finding the patterns you are discussing in this thread in some of the stocks and usually track.
Please let me know if I am deviating the objectives of your thread.
encouraging you and your technical analysis.
Vishwanath |
Thats good, Vishwanath. We can use this thread better that way, and get more opinions/ guidance
|
|
| Back to top |
|
 |
vishytns
White Belt

Joined: 26 Nov 2009
Posts: 206
|
Post: #154  Posted: Sun Nov 07, 2010 2:30 pm Post subject: Posted: Sun Nov 07, 2010 2:30 pm Post subject: |
 |
|
Casper,
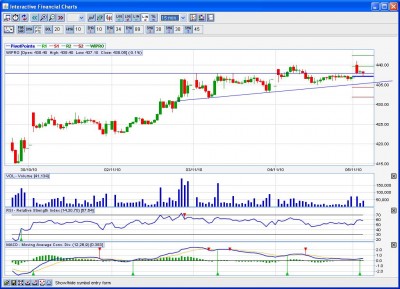
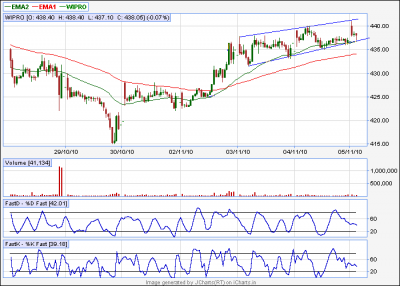
Look at wipro 15 minutes charts. If we can call this ascending triangle (there are some candles above the resistance edge) then can we expect some movement in this stock.
Let me know your views.
1. Can it form a ascending triangle?
2. Or can we consider it as symmetircal triangle?
Vishy
| Description: |
|
| Filesize: |
135.97 KB |
| Viewed: |
368 Time(s) |
|
|
|
| Back to top |
|
 |
vishytns
White Belt

Joined: 26 Nov 2009
Posts: 206
|
Post: #155  Posted: Sun Nov 07, 2010 2:48 pm Post subject: Posted: Sun Nov 07, 2010 2:48 pm Post subject: |
 |
|
Casper,
I hope i am taking your precious time.
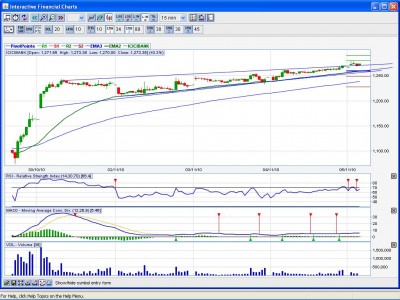
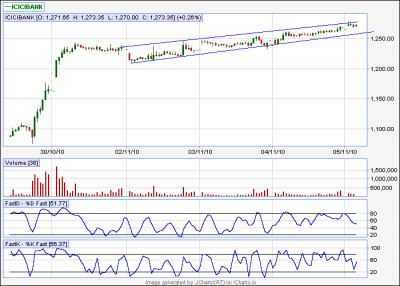
Look at the ICICIBank 15 minutes chart. I guess it is a rising wedge.
Your comments please.
regards
Vishy
| Description: |
|
| Filesize: |
140.59 KB |
| Viewed: |
369 Time(s) |
|
|
|
| Back to top |
|
 |
mrvishal_g
White Belt

Joined: 17 Sep 2010
Posts: 89
|
Post: #156  Posted: Sun Nov 07, 2010 7:04 pm Post subject: Posted: Sun Nov 07, 2010 7:04 pm Post subject: |
 |
|
Hello Casper,
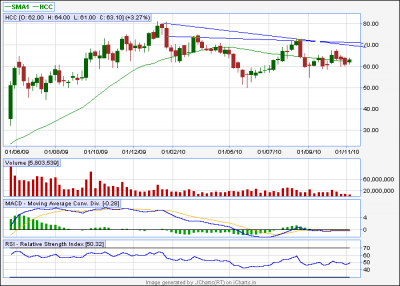
Please comment on HCC weekly chart, there is some inverted Head & Shoulder kind of pattern. also comment on Abirla or any good stock for F&O for short term.
Vishal
| Description: |
|
| Filesize: |
11.96 KB |
| Viewed: |
355 Time(s) |
|
|
|
| Back to top |
|
 |
mrvishal_g
White Belt

Joined: 17 Sep 2010
Posts: 89
|
Post: #157  Posted: Sun Nov 07, 2010 7:19 pm Post subject: Posted: Sun Nov 07, 2010 7:19 pm Post subject: |
 |
|
Casper
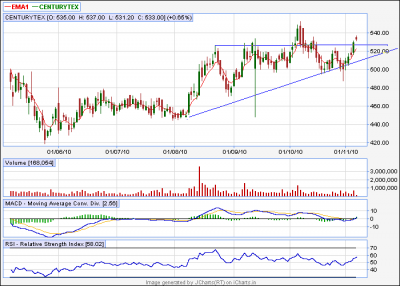
Comment of attach chart of Century Textile (assending tringle)
| Description: |
|
| Filesize: |
13.88 KB |
| Viewed: |
367 Time(s) |
|
|
|
| Back to top |
|
 |
casper
Green Belt

Joined: 02 Oct 2010
Posts: 1315
|
Post: #158  Posted: Sun Nov 07, 2010 7:40 pm Post subject: Posted: Sun Nov 07, 2010 7:40 pm Post subject: |
 |
|
hi vishy,
sorry for delay
i have got the charts u posted (wipro/icicibank)
in both the cases, i would try to explain them as channel which are yet to be broken out,
as u know that identifying wedge is the most difficult task in ta, so i am going to post my points which support the case of channel, plz consider these points and let me know wht u think
in case of wipro, the upper tl in ur chart can not be the proper upper tl,because in case of a proper tl, it can not be broken and then cant be violated and price will not come back to lower tl so easily as it did during touching 440
so 440 must be within price range, can not be the outer limit (viz upper trend line) of the price action.
so if we try to bring it within price range then we get a channel, plz see the chart and give me feed back
in case of icici bank, the same logic can be applied, if we try to bring all the highs and lows with in our price range and consider the decreasing volume , here also we get a channel,
(hi vishal, i got ur charts, now staring working on them, and will post as soon as possible, plz wait)
| Description: |
|
| Filesize: |
12.34 KB |
| Viewed: |
364 Time(s) |
|
| Description: |
|
| Filesize: |
15.33 KB |
| Viewed: |
357 Time(s) |
|
|
|
| Back to top |
|
 |
casper
Green Belt

Joined: 02 Oct 2010
Posts: 1315
|
Post: #159  Posted: Sun Nov 07, 2010 7:54 pm Post subject: Posted: Sun Nov 07, 2010 7:54 pm Post subject: |
 |
|
hi vishal,
in case of century textile, we need volume, plz dont take it lightly,
just see that it already tried to break out and touched 540, but widout vol, and the consequence is the returning to the starting point, plz note, during the returning, the vol was much higher, which suggests that the price increment was not "liked" by the market and the market brought down the price with more enthusiasm,
now for a perfect bo, we need the support of the market, but as we have the mahurat data as the last trading day so we can not say that vol was low, because due to lesser time, vol is supposed to be low
so we need to see it on monday, for a bo, we need increased vol, century has vol of 3-4 lakh on avg,
now it should be at least 7-10 lakh to make the case stronger for us
(plz let me know wht u think abt it)
|
|
| Back to top |
|
 |
vishytns
White Belt

Joined: 26 Nov 2009
Posts: 206
|
Post: #160  Posted: Sun Nov 07, 2010 8:13 pm Post subject: Posted: Sun Nov 07, 2010 8:13 pm Post subject: |
 |
|
casper,
I agree with your views on ICICI Bank and Wipro.
Thanks for careful analysis  . Actually in case of ICICIBank it requires very careful look at the charts to know that is in a channel. . Actually in case of ICICIBank it requires very careful look at the charts to know that is in a channel.
Vishy
|
|
| Back to top |
|
 |
casper
Green Belt

Joined: 02 Oct 2010
Posts: 1315
|
Post: #161  Posted: Sun Nov 07, 2010 8:17 pm Post subject: Posted: Sun Nov 07, 2010 8:17 pm Post subject: |
 |
|
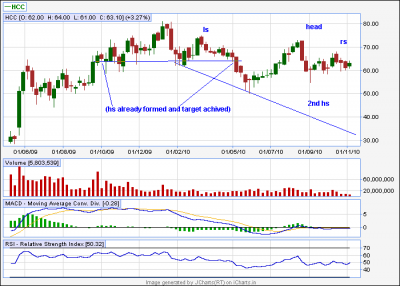
in hcc weekly, we already had a hs and target is already achieved,
in case of considering a 2nd hs pattern, if we consider the high of 12thmarch as ls and 13th august as head, then our neck line will intersect the rs at 35-30 level, if it happens it would be a disaster for hcc share holders, because after the pattern formation and break down, price will reach below 10 level 
(just joking, plz dont mind)
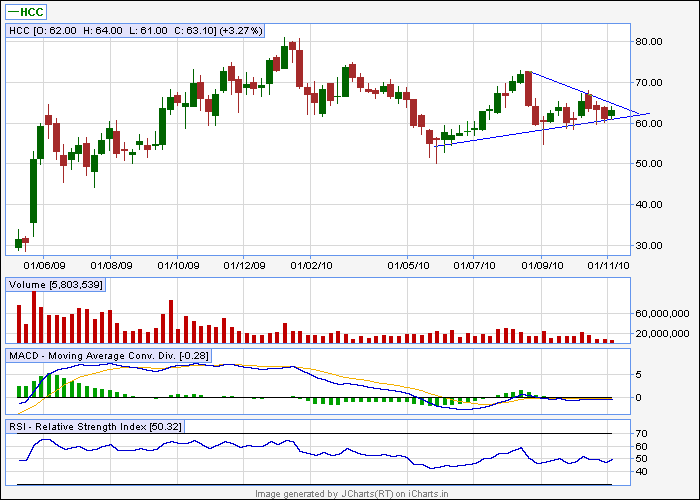
before forming that hs, we need to see what happens to the symmetrical triangle im posting, bcoz, widout breaking down frm here that hs is not going to form, in this trinagle, we have a target of 10-14 rupees, and being a sym. triangle, as it is a neutral pattern, we can not predict that which way the price will head after the break out
| Description: |
|
| Filesize: |
11.37 KB |
| Viewed: |
1604 Time(s) |
|
| Description: |
|
| Filesize: |
12.33 KB |
| Viewed: |
359 Time(s) |
|
|
|
| Back to top |
|
 |
casper
Green Belt

Joined: 02 Oct 2010
Posts: 1315
|
Post: #162  Posted: Sun Nov 07, 2010 8:22 pm Post subject: Posted: Sun Nov 07, 2010 8:22 pm Post subject: |
 |
|
hi vishy, thanks for ur feed back, u know at times we can not take a decision on our own  and discussion with friends helps us to find out an way, i was not quite sure, thats why iasked for ur views and discussion with friends helps us to find out an way, i was not quite sure, thats why iasked for ur views 
now lets hope for the best for 2mrrw
|
|
| Back to top |
|
 |
mrvishal_g
White Belt

Joined: 17 Sep 2010
Posts: 89
|
Post: #163  Posted: Sun Nov 07, 2010 9:03 pm Post subject: Posted: Sun Nov 07, 2010 9:03 pm Post subject: |
 |
|
Hi Casper,
Thanks for reply on HCC & Century Textile
I think u r right on Century but i like last two stong candle. I think tom it will clear (may be within 10 minutes of trading).
I need you comment on Abirla Nuvo & JP associates also.
Vishal
|
|
| Back to top |
|
 |
casper
Green Belt

Joined: 02 Oct 2010
Posts: 1315
|
Post: #164  Posted: Sun Nov 07, 2010 9:28 pm Post subject: Posted: Sun Nov 07, 2010 9:28 pm Post subject: |
 |
|
hi vishal,
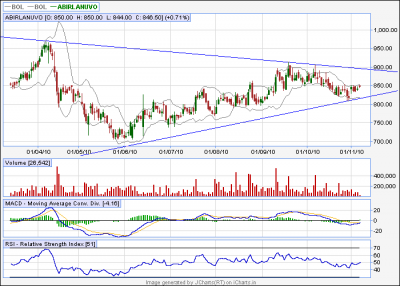
in case of abirlanuvo, a large sym. triangle is forming, but it will take time to reach the bo or bd, as the formation is under progress, bo zone should be 900 and bd will happen at 810 level
as of now, it will face resistance at the current level as its the upper band of bollinger band and will head toward 810, but its a strong support as the lower bb and lower tl intersects here, so we can expect a consolidation move here
jp associate has cleared upper bb successfully, now it has a mild resistance at the current level, if it crosses this then we can expect 140,145 in coming days
| Description: |
|
| Filesize: |
15.95 KB |
| Viewed: |
354 Time(s) |
|
|
|
| Back to top |
|
 |
vishytns
White Belt

Joined: 26 Nov 2009
Posts: 206
|
Post: #165  Posted: Sun Nov 07, 2010 10:41 pm Post subject: Posted: Sun Nov 07, 2010 10:41 pm Post subject: |
 |
|
Casper,
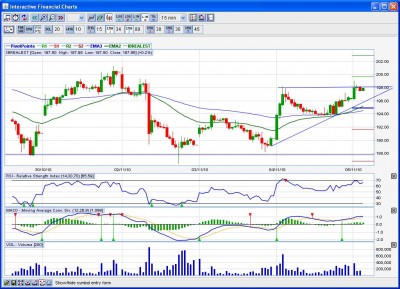
There is a formation of ascending triangle in IBREALEST. It is in the verge of BO. Check the chart and let me know your views.
Also, If this ascending triangle is a failure and in case it breaks down below 188, then we can see a head and shoulders break down. Better to watch this stock.
Vishy
| Description: |
|
| Filesize: |
148.2 KB |
| Viewed: |
360 Time(s) |
|
|
|
| Back to top |
|
 |
|
|
You cannot post new topics in this forum
You cannot reply to topics in this forum
You cannot edit your posts in this forum
You cannot delete your posts in this forum
You cannot vote in polls in this forum
You can attach files in this forum
You can download files in this forum
|
Powered by phpBB © 2001, 2005 phpBB Group
|
|
|

