|
|
| View previous topic :: View next topic |
| Author |
a layman's approach to break out and break down |
chetan83
Brown Belt

Joined: 19 Feb 2010
Posts: 2036
|
Post: #1501  Posted: Sat Jan 22, 2011 6:57 pm Post subject: Posted: Sat Jan 22, 2011 6:57 pm Post subject: |
 |
|
| singh.ravee wrote: | casper hello,
Do u remember the bank nifty explaination of sherbaaz? Wasn't that wonderful. Last two days i read entire book of steve nison on candlesticks.
I felt that in a hurry to trade, we forget the basics of our trading system and get caught. Lots of question enter into our mind as to what is sl, tgt, entry point and etc etc. In this process we miss major trading opportunities that lies in front of us. Case in point would be shorting nifty around 6100 levels after an evening star appeared there. Then we end up everyday coveting for rides on nifty and many a times get trapped.
The biggest challenge before a trader is to keep his trading system simple. Time and again bad habits of a trader push him towards complicated ways of stock assessment and subsequent trading.
Just sharing my views with you after revisiting steve nison's book.
thanks and regards
ravee. |
Rightly said Ravee,
The transparency of the Indian markets offers an array of indicators and allows deep insights of prevailing sentiment. We find the activities of NSE members like specialists and floor traders, public and odd lot short sales, the Short Interest Ratio as well as the large block transactions of the institutional investors published every week.
Other tools what we use for technical analysis include trend indicators, daily advances and declines, daily new highs and lows, volume, indices, put/call ratios and other useful information like Stochastics, RSI, MACD, TICK and more.
The problem is only that all these indicators contradict each other most of the time. Countless books have been written on this subject, and no matter how many will be written in the future: But we need to be aware that there is no such thing as the Holy Grail of the stock market.
But some people are more successful than others and the answer is quite simple:
No indicator is right all the time and we don't have to be right all the time. Just be right a higher percentage of the time than wrong. Choose some reliable indicators and stick to them. We should not follow some indicators for a while and switch to some others if they fail. Don't be a technician in the first half of the year and a fundamentalist the next half. Be consistent and disciplined in your approach. Don't abandon a good indicator because you think this time everything is different.
It takes of course a lot of guts because the opinions of the most widely quoted gurus of blue screen (TV channel's) are usually contrary to our indicators at that time.
|
|
| Back to top |
|
 |
|
| |
singh.ravee
Yellow Belt

Joined: 12 Aug 2010
Posts: 678
|
| Post: #1502 Posted: Sat Jan 22, 2011 8:04 pm Post subject: |
|
|
casper,
One point i would like to share. I know, i may sound foolish, but if i will not share and rectify on it i will remain foolish throughout my life.
Normally, i try to find trading opportunities in 5 min or 60 min intraday charts. and then decide whether to keep the position open at the end of day. I think its not appropriate.
I think one should try to find trading pattern in eod and according to these patterns should take an entry point in 60min or 5 min tf.
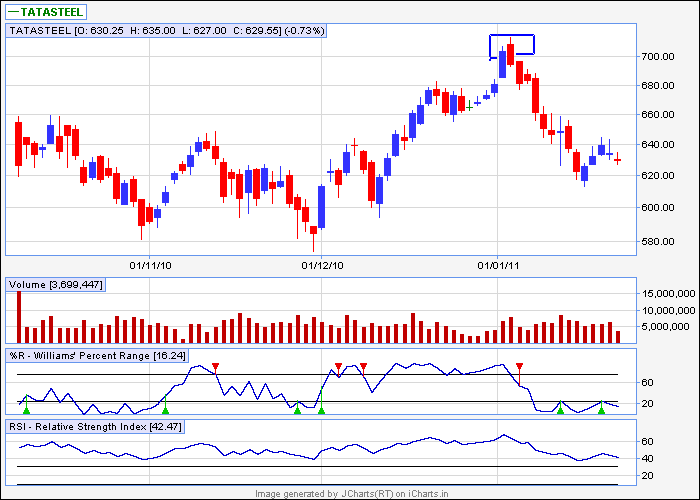
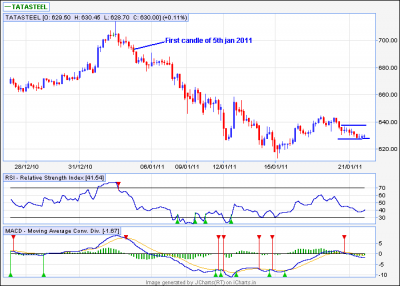
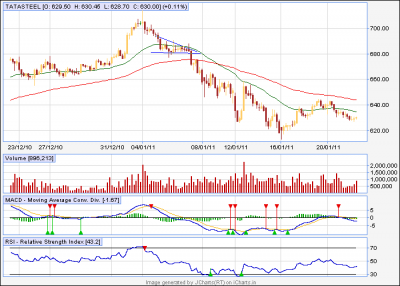
I would like to share tatasteel eod chart. A dark cloud cover pattern emerged at new high in tata steel on 3rd and 4th jan 2011. One should go short in the first candle of 5th jan as per eod chart.
If i look at 60min chart, i dont find good shorting symbol over there. May be somebody else will find. So normally I miss these opportunities and then find tata steel or for that matter any other stock 10% down.
What i am doing is that i m wasting my energy in finding short rides. In this process i miss the bigger rides.
I may sound too confused today, but these are dilemmas of a new trader.
Once these drawbacks are identified, next step is to rectify them and not to repeat the same.
Your valuable comments.
Thanks and Regards
Ravee
| Description: |
|
| Filesize: |
10.53 KB |
| Viewed: |
663 Time(s) |
|
| Description: |
|
| Filesize: |
12.7 KB |
| Viewed: |
134 Time(s) |
|
|
|
| Back to top |
|
|
casper
Green Belt

Joined: 02 Oct 2010
Posts: 1315
|
| Post: #1503 Posted: Sat Jan 22, 2011 8:22 pm Post subject: |
|
|
| singh.ravee wrote: | casper,
One point i would like to share. I know, i may sound foolish, but if i will not share and rectify on it i will remain foolish throughout my life.
Normally, i try to find trading opportunities in 5 min or 60 min intraday charts. and then decide whether to keep the position open at the end of day. I think its not appropriate.
I think one should try to find trading pattern in eod and according to these patterns should take an entry point in 60min or 5 min tf.
I would like to share tatasteel eod chart. A dark cloud cover pattern emerged at new high in tata steel on 3rd and 4th jan 2011. One should go short in the first candle of 5th jan as per eod chart.
If i look at 60min chart, i dont find good shorting symbol over there. May be somebody else will find. So normally I miss these opportunities and then find tata steel or for that matter any other stock 10% down.
What i am doing is that i m wasting my energy in finding short rides. In this process i miss the bigger rides.
I may sound too confused today, but these are dilemmas of a new trader.
Once these drawbacks are identified, next step is to rectify them and not to repeat the same.
Your valuable comments.
Thanks and Regards
Ravee |
i could not reply any of u so far, so i am really sorry
i am not giving u a total answer also
i am here to write a single sentence only, i will write to u all in detail after nine, im in a sort of discussion here now
just ask ur self how much u expect, how fast and what u can risk for that before taking any trade and jumping to any conclusion
u may find urself fresher, but i am watching u, u, phadkondu, deepakms and a few other guys whose name i can not recall at this moment, are all progressing very fast and nicely too
so u plz try to ask ur self what remuneration, how fast and with what risk u want, if needed write it in ur personal diary and try to write its possible answer, it will help u to know ur inner self
this can guide u from a true and false case
in stock market a scalper is a reality and a long term investor is also a reality, u decide what u r and what u want from it
once u decide what u want, getting that from the market is not a problem, as where there is will, there is an way
i will be back wid detail replies soon
|
|
| Back to top |
|
|
singh.ravee
Yellow Belt
Joined: 12 Aug 2010
Posts: 678
|
| Post: #1504 Posted: Sat Jan 22, 2011 8:27 pm Post subject: |
|
|
casper,
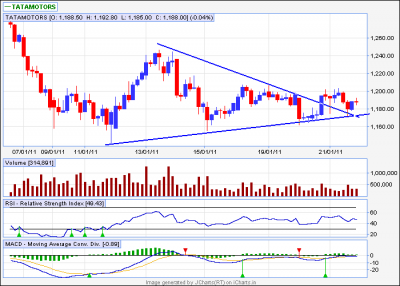
kindly re look at 60 min chart of tata motors. The similar/ symmetrical triangle took a weak breakout on the upside. and the price declines.
1. price has tested the tip of triangle which lies around 1170.
2. In few cases, i think it is acceptable and hence the triangle pattern is still valid.
3. If fresh buys come into play, and stock moves above 1200 then can we think of buying for the tgts mentioned by Ravi_S in his previous replies.
Kindly comment.
thanks and regards
ravee
| Description: |
|
| Filesize: |
11.93 KB |
| Viewed: |
133 Time(s) |
|
|
|
| Back to top |
|
|
chrome
Yellow Belt
Joined: 28 Dec 2009
Posts: 645
|
| Post: #1505 Posted: Sat Jan 22, 2011 9:13 pm Post subject: |
|
|
| singh.ravee wrote: | casper,
One point i would like to share. I know, i may sound foolish, but if i will not share and rectify on it i will remain foolish throughout my life.
Normally, i try to find trading opportunities in 5 min or 60 min intraday charts. and then decide whether to keep the position open at the end of day. I think its not appropriate.
I think one should try to find trading pattern in eod and according to these patterns should take an entry point in 60min or 5 min tf.
I would like to share tatasteel eod chart. A dark cloud cover pattern emerged at new high in tata steel on 3rd and 4th jan 2011. One should go short in the first candle of 5th jan as per eod chart.
If i look at 60min chart, i dont find good shorting symbol over there. May be somebody else will find. So normally I miss these opportunities and then find tata steel or for that matter any other stock 10% down.
What i am doing is that i m wasting my energy in finding short rides. In this process i miss the bigger rides.
I may sound too confused today, but these are dilemmas of a new trader.
Once these drawbacks are identified, next step is to rectify them and not to repeat the same.
Your valuable comments.
Thanks and Regards
Ravee |
hi ravee,
gud point u briefed..shorter time frame always follow the longer one..one should always check eod charts before going into a live trade based on 1/5/60 min charts. Less hicups will be there by following up this rule..
|
|
| Back to top |
|
|
sherbaaz
Yellow Belt
Joined: 27 May 2009
Posts: 543
|
| Post: #1506 Posted: Sun Jan 23, 2011 8:33 am Post subject: |
|
|
| chrome wrote: | | singh.ravee wrote: | casper,
One point i would like to share. I know, i may sound foolish, but if i will not share and rectify on it i will remain foolish throughout my life.
Normally, i try to find trading opportunities in 5 min or 60 min intraday charts. and then decide whether to keep the position open at the end of day. I think its not appropriate.
I think one should try to find trading pattern in eod and according to these patterns should take an entry point in 60min or 5 min tf.
I would like to share tatasteel eod chart. A dark cloud cover pattern emerged at new high in tata steel on 3rd and 4th jan 2011. One should go short in the first candle of 5th jan as per eod chart.
If i look at 60min chart, i dont find good shorting symbol over there. May be somebody else will find. So normally I miss these opportunities and then find tata steel or for that matter any other stock 10% down.
What i am doing is that i m wasting my energy in finding short rides. In this process i miss the bigger rides.
I may sound too confused today, but these are dilemmas of a new trader.
Once these drawbacks are identified, next step is to rectify them and not to repeat the same.
Your valuable comments.
Thanks and Regards
Ravee |
hi ravee,
gud point u briefed..shorter time frame always follow the longer one..one should always check eod charts before going into a live trade based on 1/5/60 min charts. Less hicups will be there by following up this rule.. |
Hi ravee,
the problem is too many ppl are trying to make their trade entry too right. there are many things which need to be considered in trading.
r u a day trader or swing trader or positional trader. you have to decide it first its one of the painful decision u have to make. if u keep yr self undecided sooner or latter you will be in a great state of confusion and frustration. lot many ppl here are doing intra day trading on 60 min tf i wonder how ??? as such higher time is not feasible for day trading.
if u r a day trader there are not many things u can chk on daily charts as to my understanding for day trading 5-15 min tf chart is fine keeping 60 min tf chart as a base chart instead of eod chart. make it a point to the extreme of stubbornness that you will be out of the trade by 3:30. if u cant do this u r not a day trader u lack discipline of day trading.
if u want to do swing trading then i think15- 30-60 min tf are better dont go below this to have micro analysis as it will absolutely confuse you for sure . but with swing trading u need to hold your position from 2-5 days for tgt and then for shorts u have to go for stock futures.
deciding what type of trader you want to be define your future of trading.
regards,
|
|
| Back to top |
|
|
singh.ravee
Yellow Belt
Joined: 12 Aug 2010
Posts: 678
|
| Post: #1507 Posted: Sun Jan 23, 2011 8:48 am Post subject: How to Trade?? |
|
|
thank u so much to all seniors for their valuable comments. capser bhai i m still waiting for ur detailed reponse, as and when possible.
i feel 60 min and swing trading suits my temperament. Interestingly, when i analyse my failed trades, most of them are in 5 min time frame.
Now will work with renewed energy to find rides/ slides.
rgds
ravee
|
|
| Back to top |
|
|
casper
Green Belt
Joined: 02 Oct 2010
Posts: 1315
|
| Post: #1508 Posted: Sun Jan 23, 2011 8:52 am Post subject: |
|
|
| girishhu1 wrote: | hellow casperji,
just returned from vacation. wish you speedy recovery from fever.
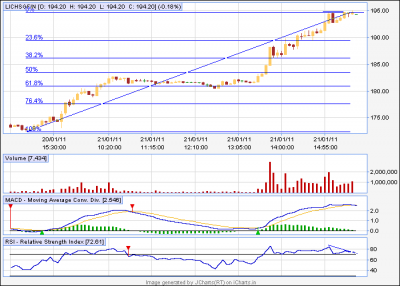
kindly comment on bank of india and lic hsg finance. both have broken out of downward sloping trendline on eod alongwith volume . on hourly time frame both have broken out of at and almost reached target of at.rsi is in overbought level on hourly. what should be our strategy for intraday trading? short for a little correction or wait for small correction and then buy at 34 ema level. please note that both stocks, as per stockglance, are in bearish mode in medium (21 days)and long term (63 days ) basis and bullish on short term basis(5 day) . in fact the 5 day increase for both stocks is in the range of 15-30%. i think if stock closes above 201 and remains there for 1/2 days on closing basis then bottom formation is complete in case of lic hsg fin.
waiting for your reply.
regards,
girish |
hii girish bhaiya,
in lichsgfin i see - div in 5 min chart, i expect it to go down to 190 which is monthly pivot in basic chart, and then if it holds MP, it will zoom again
this share was up do to unexpectedly positive results
and i am a little reluctant to trade banking shares up to Wednesday, the RBI will announce its policy on tues day, only after that, the course of banking shares will be decided, so i dont want to go for any wild gose chasing before that
| Description: |
|
| Filesize: |
12.22 KB |
| Viewed: |
119 Time(s) |
|
|
|
| Back to top |
|
|
casper
Green Belt
Joined: 02 Oct 2010
Posts: 1315
|
| Post: #1509 Posted: Sun Jan 23, 2011 9:10 am Post subject: |
|
|
| singh.ravee wrote: | casper,
kindly re look at 60 min chart of tata motors. The similar/ symmetrical triangle took a weak breakout on the upside. and the price declines.
1. price has tested the tip of triangle which lies around 1170.
2. In few cases, i think it is acceptable and hence the triangle pattern is still valid.
3. If fresh buys come into play, and stock moves above 1200 then can we think of buying for the tgts mentioned by Ravi_S in his previous replies.
Kindly comment.
thanks and regards
ravee |
sorry ravee
i can not consider this as a valid break out,
in this so called bo, we have just normal volume with the bo candle, but to qualify as a break out we need increased volume
if we consider it a valid break out, then the price, with increased volume would break out 1180 level and stay at 1215 and preferably close there, but it did not ( which is 3% of the bo point, i hope u know 3% or 3 day rules, i use 3% as i can not use 3 day rules in day trading)
considering this kinds of facts, i will regard this as a symmetrical triangle in formation only
|
|
| Back to top |
|
|
casper
Green Belt
Joined: 02 Oct 2010
Posts: 1315
|
| Post: #1510 Posted: Sun Jan 23, 2011 9:41 am Post subject: |
|
|
| singh.ravee wrote: | casper,
One point i would like to share. I know, i may sound foolish, but if i will not share and rectify on it i will remain foolish throughout my life.
Normally, i try to find trading opportunities in 5 min or 60 min intraday charts. and then decide whether to keep the position open at the end of day. I think its not appropriate.
I think one should try to find trading pattern in eod and according to these patterns should take an entry point in 60min or 5 min tf.
I would like to share tatasteel eod chart. A dark cloud cover pattern emerged at new high in tata steel on 3rd and 4th jan 2011. One should go short in the first candle of 5th jan as per eod chart.
If i look at 60min chart, i dont find good shorting symbol over there. May be somebody else will find. So normally I miss these opportunities and then find tata steel or for that matter any other stock 10% down.
What i am doing is that i m wasting my energy in finding short rides. In this process i miss the bigger rides.
I may sound too confused today, but these are dilemmas of a new trader.
Once these drawbacks are identified, next step is to rectify them and not to repeat the same.
Your valuable comments.
Thanks and Regards
Ravee |
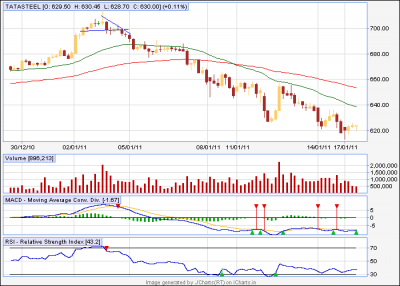
bhai
u could not find a single shorting opportunity in tatasteel
i am giving u two opportunities
1st was at 700 and the second was around 680,which was then monthly pivot
by these two charts i hope, i have proved that the problem was not with 60 min tf?
u know, one has to follow a system religiously, then only one can master it and trade it, its not like venturing all the systems simultaneously
if u have mastered the art of candle stick analysis and wants to trade in that way, then who am i to comment? like that, if i feel comfortable to use 60 min chart for day trading, i hope no body should have any thing to say, becoz at the end of day, nothing succeeds like success and whether my system is okey or not, is clearly evident in this thread,
i dont need any body's certificate to know about my system
but one thing i can tell u for sure, this thread is dedicated to break out break down ideas, mostly in eod and 60 min charts, i put my effort in this system and when i was a fresher, no body helped me with a tinka also
Those horrific days still hunts me, that why i never fell short to reply ANY of urs query related with any topics ( i am not telling u only, i include every reader)
but at the end of days, its essentially a break out break down thread considering only eod or 60 min chart
we have no shortage of analytical styles in this vast world of t.a. if some body finds success in other way, he is at his liberty to do that, i am not going to drop my comment on his method bcoz i am not a jack of all trades, at the same, i do expect that peoples would have that much courtesy not to put there ideas on my systems without taking time to follow it
and at the end of every thing, i will once tell u, i have lots of better things to do than joining a comment war, so i hope no more controversy should prevail on this
| Description: |
|
| Filesize: |
14.31 KB |
| Viewed: |
125 Time(s) |
|
| Description: |
|
| Filesize: |
12.08 KB |
| Viewed: |
140 Time(s) |
|
|
|
| Back to top |
|
|
singh.ravee
Yellow Belt
Joined: 12 Aug 2010
Posts: 678
|
| Post: #1511 Posted: Sun Jan 23, 2011 9:50 am Post subject: |
|
|
casper,
i got ur point. i should devise a trading strategy and should religiously stick to it. I should try to improvise my trading strategy instead of looking for some new ideas to trade.
Let's seal it today.
candlesticks + 60min tf and eod + triangles + macd+ rsi.
thanks for ur valuable comments.
rgds
ravee
|
|
| Back to top |
|
|
singh.ravee
Yellow Belt
Joined: 12 Aug 2010
Posts: 678
|
| Post: #1512 Posted: Sun Jan 23, 2011 9:53 am Post subject: |
|
|
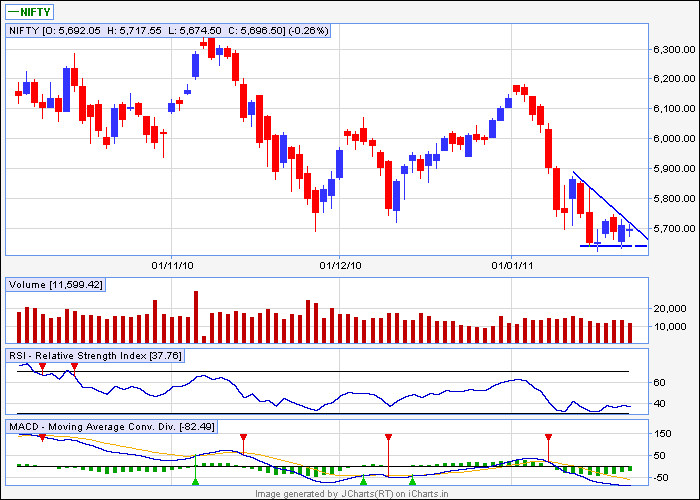
casper,
is it a descending triangle in nifty eod.
ravee
| Description: |
|
| Filesize: |
10.67 KB |
| Viewed: |
771 Time(s) |
|
|
|
| Back to top |
|
|
singh.ravee
Yellow Belt
Joined: 12 Aug 2010
Posts: 678
|
| Post: #1513 Posted: Sun Jan 23, 2011 10:02 am Post subject: |
|
|
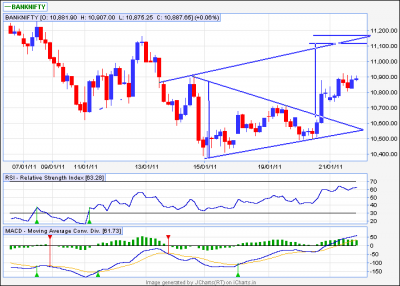
casper,
it seems to be a symmetrical triangle breakout in bank nifty. No doubt i m late to catch it.
consider this cmp= 10890; tgt= 11120- 11170 (if i have calculated it right)
sl= 10800; still around 200 pts ride is left with 90 pts sl.
kindly comment.
ravee
| Description: |
|
| Filesize: |
12.79 KB |
| Viewed: |
123 Time(s) |
|
|
|
| Back to top |
|
|
singh.ravee
Yellow Belt
Joined: 12 Aug 2010
Posts: 678
|
| Post: #1514 Posted: Sun Jan 23, 2011 10:29 am Post subject: |
|
|
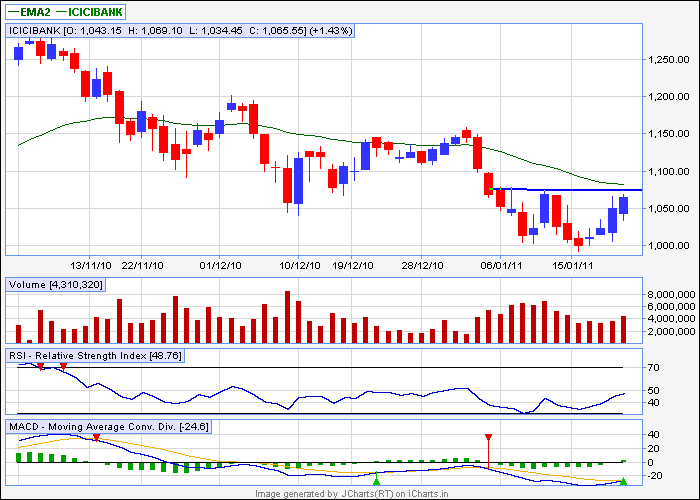
casper,
it seems to be a double bottom under formation in icici bank. neckline= 1075. 35 ema= 1080.
Buy above 1080 for 1150.
Kindly share your observation.
rgds
ravee
| Description: |
|
| Filesize: |
11.45 KB |
| Viewed: |
832 Time(s) |
|
|
|
| Back to top |
|
|
singh.ravee
Yellow Belt
Joined: 12 Aug 2010
Posts: 678
|
| Post: #1515 Posted: Sun Jan 23, 2011 10:35 am Post subject: |
|
|
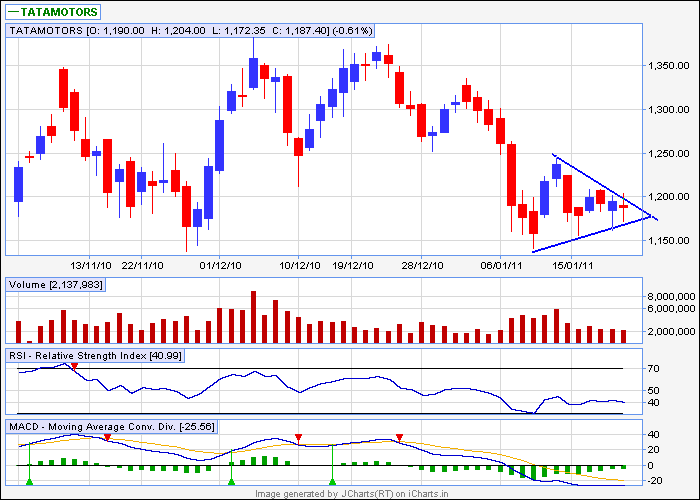
casper,
is it a symmetrical triangle in tatamotors eod. or is it a bearish pendant.
I dont know about pendants. heard this word in thread only.
kindly comment, with possible tgts and sl.
rgds
ravee
| Description: |
|
| Filesize: |
11.58 KB |
| Viewed: |
873 Time(s) |
|
|
|
| Back to top |
|
|
|
|
You cannot post new topics in this forum
You cannot reply to topics in this forum
You cannot edit your posts in this forum
You cannot delete your posts in this forum
You cannot vote in polls in this forum
You can attach files in this forum
You can download files in this forum
|
Powered by phpBB © 2001, 2005 phpBB Group
|
|
|


