|
|
| View previous topic :: View next topic |
| Author |
a layman's approach to break out and break down |
singh.ravee
Yellow Belt

Joined: 12 Aug 2010
Posts: 678
|
|
| Back to top |
|
 |
|
| |
abhideep
White Belt

Joined: 17 Jan 2010
Posts: 46
|
Post: #1532  Posted: Tue Jan 25, 2011 9:02 pm Post subject: Posted: Tue Jan 25, 2011 9:02 pm Post subject: |
 |
|
hi all
Can any senior check up TISCO charts and confirm breakout???
Similarly LIChsgFin??
Its closed 2 times above 34ema??
I intend taking positional trades on thursday.
Please guide me.
Regards
|
|
| Back to top |
|
|
singh.ravee
Yellow Belt
Joined: 12 Aug 2010
Posts: 678
|
| Post: #1533 Posted: Wed Jan 26, 2011 10:18 am Post subject: |
|
|
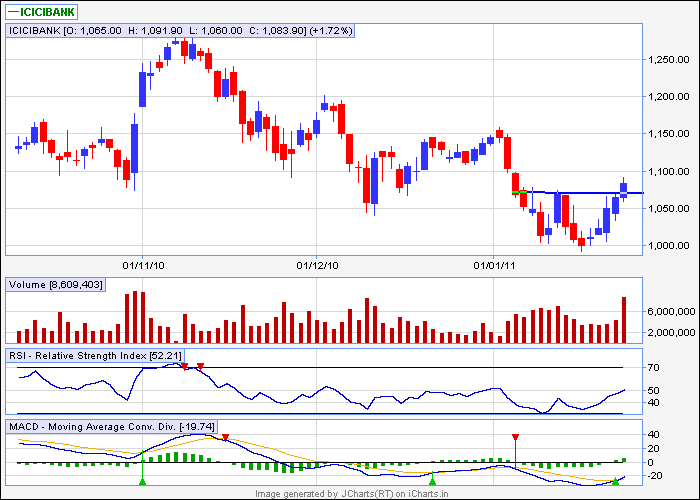
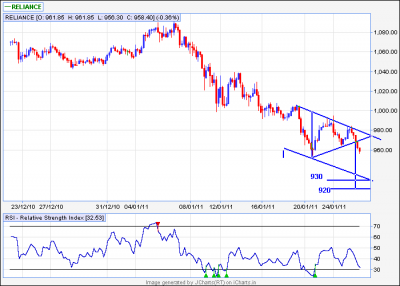
casper hello,
it seems as if symmetrical triangle in reliance 60min has broken down.
kindly share your observation.
thnx n rgds
ravee
| Description: |
|
| Filesize: |
12.99 KB |
| Viewed: |
156 Time(s) |
|
|
|
| Back to top |
|
|
girishhu1
White Belt
Joined: 17 Aug 2009
Posts: 316
|
| Post: #1534 Posted: Fri Jan 28, 2011 12:10 pm Post subject: |
|
|
hellow casperji,
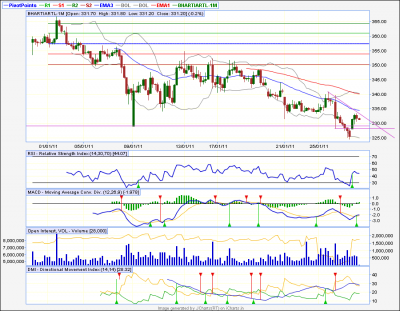
bharti had bd from dt in eod chart yesterday. again today a dt is in formation in hourly chart. should we short below 328 with stop loss of 334 for a target of rs 12?
regards,
girish
| Description: |
|
| Filesize: |
53.29 KB |
| Viewed: |
130 Time(s) |
|
|
|
| Back to top |
|
|
casper
Green Belt

Joined: 02 Oct 2010
Posts: 1315
|
| Post: #1535 Posted: Fri Jan 28, 2011 12:26 pm Post subject: |
|
|
| girishhu1 wrote: | hellow casperji,
bharti had bd from dt in eod chart yesterday. again today a dt is in formation in hourly chart. should we short below 328 with stop loss of 334 for a target of rs 12?
regards,
girish |
its not a perfect dt
but the price has got rejected from monthly s1 at 332, now we can sell here also wid a sl above monthly s1, or we can sell below weekly s1 at 327 (cmp 328)
in case we sell below weekly s1 of 327,( this is better than selling at this level) our target should be 319 as weekly s2 and 308 as monthly s2, so our sl will be a close above weekly level of 327 in 60 min chart
all levels are as per basic chart
|
|
| Back to top |
|
|
girishhu1
White Belt
Joined: 17 Aug 2009
Posts: 316
|
| Post: #1536 Posted: Fri Jan 28, 2011 1:04 pm Post subject: |
|
|
| casper wrote: | | girishhu1 wrote: | hellow casperji,
bharti had bd from dt in eod chart yesterday. again today a dt is in formation in hourly chart. should we short below 328 with stop loss of 334 for a target of rs 12?
regards,
girish |
its not a perfect dt
but the price has got rejected from monthly s1 at 332, now we can sell here also wid a sl above monthly s1, or we can sell below weekly s1 at 327 (cmp 328)
in case we sell below weekly s1 of 327,( this is better than selling at this level) our target should be 319 as weekly s2 and 308 as monthly s2, so our sl will be a close above weekly level of 327 in 60 min chart
all levels are as per basic chart |
hi casperji,
thanks for prompt reply.
but can you explain 'its not a perfect dt' so that next time i may post a perfect dt 
regards
girish
|
|
| Back to top |
|
|
casper
Green Belt
Joined: 02 Oct 2010
Posts: 1315
|
| Post: #1537 Posted: Fri Jan 28, 2011 1:51 pm Post subject: |
|
|
by perfect dt i mean
any dt (and any other triangle too) where u are drawing tls with two distinct
points, and preferably with 3 distinct point per tl
in case of bharti
the main dt broken down earlier, now u r increasing the down tl of that dt to make another dt, this is not a perfect tl as u dont hv 2 kissing points on that down tl any more (u hv break down in between)
so i will say its not a perfect dt as down tl is already violated
u know bhaiya
in any pattern, the down tl manifests the support and upper tl shows ur resistance
in case of a breaching already a few candles earlier, the support wont be that strong any more, so to show that we have enough support to break, we have to find proper tls
( we break strong sup/resi violently hence the name break out is coming, and that is the reason of fast, very fast move after a break out, so presence of strong sup/resi is very important)
|
|
| Back to top |
|
|
girishhu1
White Belt
Joined: 17 Aug 2009
Posts: 316
|
| Post: #1538 Posted: Fri Jan 28, 2011 2:28 pm Post subject: |
|
|
| casper wrote: | by perfect dt i mean
any dt (and any other triangle too) where u are drawing tls with two distinct
points, and preferably with 3 distinct point per tl
in case of bharti
the main dt broken down earlier, now u r increasing the down tl of that dt to make another dt, this is not a perfect tl as u dont hv 2 kissing points on that down tl any more (u hv break down in between)
so i will say its not a perfect dt as down tl is already violated
u know bhaiya
in any pattern, the down tl manifests the support and upper tl shows ur resistance
in case of a breaching already a few candles earlier, the support wont be that strong any more, so to show that we have enough support to break, we have to find proper tls
( we break strong sup/resi violently hence the name break out is coming, and that is the reason of fast, very fast move after a break out, so presence of strong sup/resi is very important) |
hi,
one more question.
'so i will say its not a perfect dt as down tl is already violated' the downtl is violated 2 times, one in downward dir and one in upward dir.if u r talking of downward violation, then it should have proved correctness of pattern and today it should have moved in down direction from morning only. so i agree that it was not a perfet dt.
if u r talking of upward violation as seen by green candles, then does it mean that the pattern has failed ?
also how one can explain todays downmove in that case? is it because of eod dt?
also one is expected to enter on completion of pattern. so shoud i wait until violation of down trendline or enter on rejection from some pivot , considering overall trend?
i m confused. hope not confusing u. 
regards,
girish
Last edited by girishhu1 on Sat Jan 29, 2011 6:16 am; edited 1 time in total |
|
| Back to top |
|
|
casper
Green Belt
Joined: 02 Oct 2010
Posts: 1315
|
| Post: #1539 Posted: Fri Jan 28, 2011 2:42 pm Post subject: |
|
|
no no, u r not confusing me at all, i will be back with a detailed reply after the market hours
by da way, just telling u that i was talking about the lower tl only, but i will be back
|
|
| Back to top |
|
|
girishhu1
White Belt
Joined: 17 Aug 2009
Posts: 316
|
| Post: #1540 Posted: Fri Jan 28, 2011 2:51 pm Post subject: |
|
|
hi casperji,
ok.
check andhra bank. i think it is near to breaking of downpivot in 30 m tf.
just for info
regards,
girish
|
|
| Back to top |
|
|
casper
Green Belt
Joined: 02 Oct 2010
Posts: 1315
|
| Post: #1541 Posted: Sat Jan 29, 2011 9:55 am Post subject: |
|
|
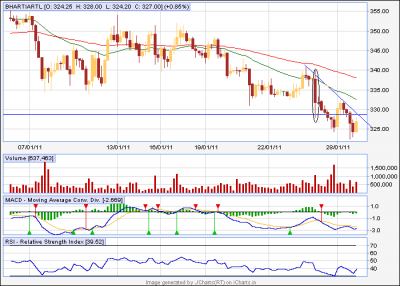
hi girish bhaiyaa
our main problem with the bhartiartl chart is due to its downtl, if its a valid tl then only we can expect a break out by breaking this tl, otherwise , there is no question to break out
now at first, let us consider a cash chart i am posting with this reply, in this chart, its clearly seen that we lack two candles to draw the down tl, so as per this chart, the down tl, in case of 1st violation towards downward level, did not exists, so as per cash chart, the case of 1st break down is not valid, as we have no support line to break
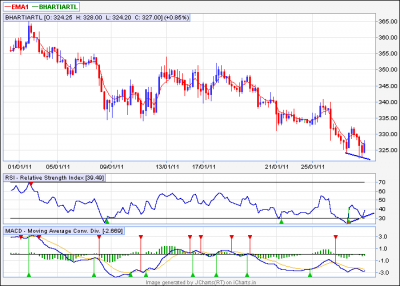
now let us consider the future chart u posted, there also, before downward violation of down tl, we really dont have a proper down tl at all, reasons are
1. the two points u r connecting in future chart to get this tl is too far, in case of a proper support level, a long tl like this should have get more candles touching to it, but we have only two candles doing so, and that too, very far situated candles
2. one of the two candles is abnormally low, which is shown like a very gap down opening of that candle, which is not in tandem with the other candles of that series, so it was an abnormal situation, during pattern selecting, we have to stay way from this candles as far as possible, bcoz it will loose the meaning of the pattern
( the meaning of descending triangle is, lower highs but equal low, which shows that some guys are buying heavily while the stock is going down, its coming down to that buy order, then, due to heavy buying, its taking support and then going up, but as no buyer is seen in upper level, its coming down again, and then again going up due to the support, so we conclude that when the buying power at the lower level is finished, it will have no support and will come down heavily, this is the dt break down)
if we consider these two points as the down tl in future chart, then the essence of the pattern will be lost
3. finally, the upper tl of the pattern is too small in comparison with the long lower tl, so as a whole, it has no symmetry at all
so we can conclude that this down tl is not valid one, hence the question of downward violation is not valid
now let us come to the rejection case
if the down tl is not valid during the 1st bd, then the pattern itself is not valid, so there was no pattern, but then how to trade the down move?
the answer is , we have to short the down move at a resistance and book it near a support, now after a rejection from the pivot levels,that level will be our resistance, so with a sl above this resi, we can short it for the next support
( sorry for late reply, u know bhaiyaa, when u get used to with a pattern, u can just see and say if its valid one or not, but to write why this is valid and why this is not valid u have to think in a cool mind, and test it in various way, i had to test it before i could draw the conclusion that this pattern is not valid one)
ps: in the chart, i have marked a red candle which, one can mistake as a candle taking support from down tl, but if u see minutely, then u will see that this candle has not taken support in that down tl
| Description: |
|
| Filesize: |
26.72 KB |
| Viewed: |
178 Time(s) |
|
|
|
| Back to top |
|
|
singh.ravee
Yellow Belt
Joined: 12 Aug 2010
Posts: 678
|
| Post: #1542 Posted: Sat Jan 29, 2011 8:47 pm Post subject: |
|
|
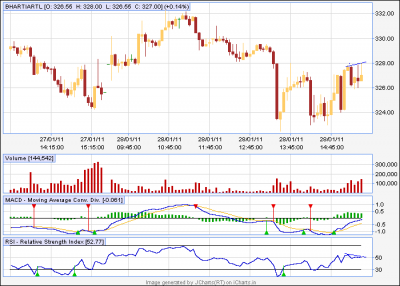
casper hello,
is it a bullish divergence in bharti in 60 min?
one can think of buying above 327 for 332 and sl= 325
your valuable comments please
thanks and rgds
ravee
| Description: |
|
| Filesize: |
15.14 KB |
| Viewed: |
142 Time(s) |
|
|
|
| Back to top |
|
|
casper
Green Belt
Joined: 02 Oct 2010
Posts: 1315
|
| Post: #1543 Posted: Sun Jan 30, 2011 8:01 am Post subject: |
|
|
hii ravee
we have + div in 60min as u posted and - div in 5 min chart
i expect it to go down first then it will come up
( i have seen that smaller tf divergence effects in early trade and higher tf divergence comes in to effect only around 12 o' clock or even later)
| Description: |
|
| Filesize: |
12.25 KB |
| Viewed: |
146 Time(s) |
|
|
|
| Back to top |
|
|
girishhu1
White Belt
Joined: 17 Aug 2009
Posts: 316
|
| Post: #1544 Posted: Sun Jan 30, 2011 8:14 am Post subject: |
|
|
hi casperji aka tushar,
nicely explained. thanks a lot.
let's hope i would be able to post a valid pattern soon.
regards,
girish
|
|
| Back to top |
|
|
sherbaaz
Yellow Belt
Joined: 27 May 2009
Posts: 543
|
| Post: #1545 Posted: Sun Jan 30, 2011 9:34 am Post subject: |
|
|
| singh.ravee wrote: | casper hello,
is it a bullish divergence in bharti in 60 min?
one can think of buying above 327 for 332 and sl= 325
your valuable comments please
thanks and rgds
ravee |
hi,
when stock is making LOWER HIGHS why you want to go long wait for trend to change and ride the trend.
regards,
|
|
| Back to top |
|
|
|
|
You cannot post new topics in this forum
You cannot reply to topics in this forum
You cannot edit your posts in this forum
You cannot delete your posts in this forum
You cannot vote in polls in this forum
You can attach files in this forum
You can download files in this forum
|
Powered by phpBB © 2001, 2005 phpBB Group
|
|
|