| View previous topic :: View next topic |
| Author |
a layman's approach to break out and break down |
singh.ravee
Yellow Belt

Joined: 12 Aug 2010
Posts: 678
|
Post: #1546  Posted: Sun Jan 30, 2011 11:28 am Post subject: Posted: Sun Jan 30, 2011 11:28 am Post subject: |
 |
|
sherbaaz bhai,
thanks for your observation. if i have understood u clearly, u wish to say.
1. try to trade in the direction of trend and avoid contra trades.
2. my problem is i dont know how to spot change in trend. however, i use 50ema as a marker of trend. any price which is above 50 ema is in uptrend and vice versa.
3. during the trend change period lots of point in price is lost. Sometimes i feel that i should trade that period also or for that matter any pullback in downtrend.
4. thats why this chart was posted.
just to share, last week undertook only 2 trades that too in the overall direction of market.
keep sharing.
regards
ravee
|
|
| Back to top |
|
 |
|
|
|
singh.ravee
Yellow Belt
Joined: 12 Aug 2010
Posts: 678
|
| Post: #1547 Posted: Sun Jan 30, 2011 11:43 am Post subject: |
|
|
casper,
if possible kindly share something on money management techniques. At least it will help all to cut our losses.
for me money management in simple terms mean maximum loss that i should book in a trade, should not be big enough to crush me and should not kick me out from the market.
thanks and regards
ravee
|
|
| Back to top |
|
|
sairanga19
White Belt

Joined: 28 Nov 2009
Posts: 51
|
| Post: #1548 Posted: Sun Jan 30, 2011 12:46 pm Post subject: money management |
|
|
dear friends,
money management is most neglected part in investing or trading in stock market. A person without technical or fundamental knowledge
can still make money with proper money management.
suppose if you are trading mini-nifty margin money you have to pay is rs.14500.00 that is 12% of mini-nifty futures level trading at
6000 *Rs 20.00=Rs. 120000.00. according to money management theory you have to keep 40% of contract value i.e Rs 48000.00 to trade mini-nifty futures.
always trade with the trend never fight the trend.never trade intraday .take trading decision on eod basis only 
|
|
| Back to top |
|
|
bassan
White Belt
Joined: 01 Dec 2009
Posts: 57
|
| Post: #1549 Posted: Sun Jan 30, 2011 9:27 pm Post subject: jswsteel-eod |
|
|
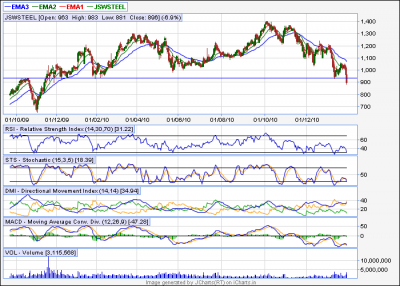
HI Casper,
attaching jswsteel eod chart. Your view pls.
| Description: |
|
| Filesize: |
38.61 KB |
| Viewed: |
144 Time(s) |
|
|
|
| Back to top |
|
|
casper
Green Belt

Joined: 02 Oct 2010
Posts: 1315
|
| Post: #1550 Posted: Mon Jan 31, 2011 9:28 am Post subject: |
|
|
wanted to post it in the "important news" thread, but cud not find the option, so posting it here
| Description: |
|
| Filesize: |
71.08 KB |
| Viewed: |
123 Time(s) |

|
|
|
| Back to top |
|
|
casper
Green Belt
Joined: 02 Oct 2010
Posts: 1315
|
| Post: #1551 Posted: Mon Jan 31, 2011 9:35 am Post subject: Re: jswsteel-eod |
|
|
| bassan wrote: | HI Casper,
attaching jswsteel eod chart. Your view pls. |
cud not update u, sorry brother, now if u r already short,,watch out 840 level, it may be a potential target
below with only support is around 772
plz dont trade for targets either, we are falling for EGYPT now, its a news based phenomenon, hence, its far from any logical movement, market will be volatile
|
|
| Back to top |
|
|
casper
Green Belt
Joined: 02 Oct 2010
Posts: 1315
|
| Post: #1552 Posted: Mon Jan 31, 2011 12:04 pm Post subject: |
|
|
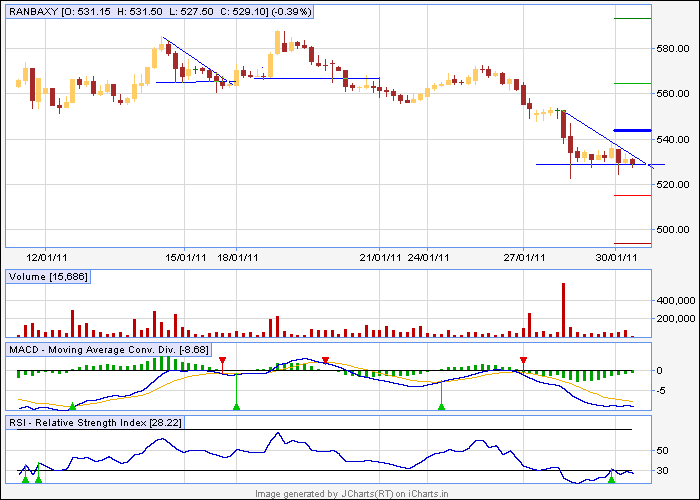
shorting ranbaxy below 526
sl is a candle close above bd level
no support is seen upto 515
let see
| Description: |
|
| Filesize: |
11.55 KB |
| Viewed: |
891 Time(s) |
|
|
|
| Back to top |
|
|
Ravi_S
Yellow Belt
Joined: 15 Jun 2009
Posts: 569
|
| Post: #1553 Posted: Mon Jan 31, 2011 10:22 pm Post subject: |
|
|
Casper, did you short this today? It broke out on the top...
| casper wrote: | shorting ranbaxy below 526
sl is a candle close above bd level
no support is seen upto 515
let see |
|
|
| Back to top |
|
|
casper
Green Belt
Joined: 02 Oct 2010
Posts: 1315
|
| Post: #1554 Posted: Mon Jan 31, 2011 11:10 pm Post subject: |
|
|
| Ravi_S wrote: | Casper, did you short this today? It broke out on the top...
| casper wrote: | shorting ranbaxy below 526
sl is a candle close above bd level
no support is seen upto 515
let see |
|
yes, for the very next candle to bo it was okey, shorted when it came to bd level, and then next candle hit my tsl, it was 2pm candle, then on 3pm candle, it went up as if a ghost was chasing it 
rsi was rising during pattern formation, i should have avoided it 
|
|
| Back to top |
|
|
singh.ravee
Yellow Belt
Joined: 12 Aug 2010
Posts: 678
|
| Post: #1555 Posted: Tue Feb 01, 2011 10:11 am Post subject: |
|
|
casper hello,
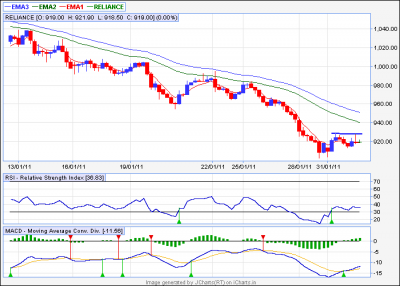
i m attaching 60 min chart of reliance ind. There is a doji confirming top in a congestion band.
Had this been at the top, i would have gone short. Since setup is similar, i think one can go short around 920 with sl= 930.
only concern is that rsi is rising.
kindly comment
thanks and regards
ravee
| Description: |
|
| Filesize: |
13.29 KB |
| Viewed: |
114 Time(s) |
|
|
|
| Back to top |
|
|
casper
Green Belt
Joined: 02 Oct 2010
Posts: 1315
|
| Post: #1556 Posted: Tue Feb 01, 2011 10:13 am Post subject: |
|
|
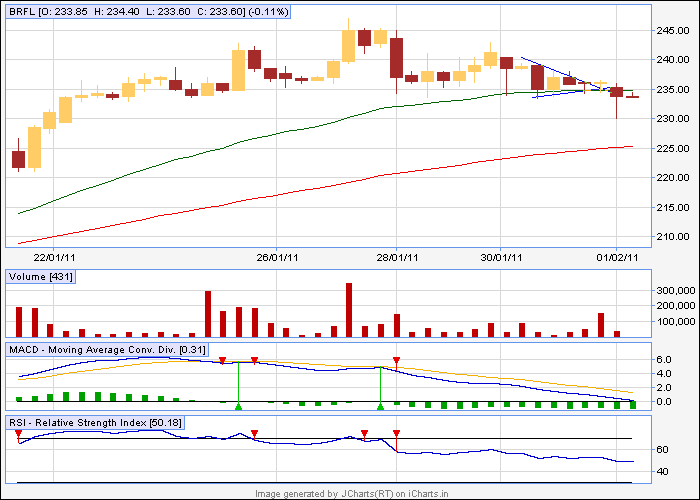
brfl
it was St which broken down on 1st candle, the red hammer
now its visiting bd level, 34 ema is resi
normally i wud avoid it due to hammer's shadow almost reached the target, but given nifty spot below 5490, im going to short brfl with sl above 234.75, current 34 ema in my chart
| Description: |
|
| Filesize: |
9.97 KB |
| Viewed: |
577 Time(s) |
|
|
|
| Back to top |
|
|
casper
Green Belt
Joined: 02 Oct 2010
Posts: 1315
|
| Post: #1557 Posted: Tue Feb 01, 2011 10:25 am Post subject: |
|
|
| singh.ravee wrote: | casper hello,
i m attaching 60 min chart of reliance ind. There is a doji confirming top in a congestion band.
Had this been at the top, i would have gone short. Since setup is similar, i think one can go short around 920 with sl= 930.
only concern is that rsi is rising.
kindly comment
thanks and regards
ravee |
though i cud not see any div in rsi, and rsi is following the price, but if it were in top as u said, or had the rsi been OB, i wud also short
now at this moment, in 5 min chart, 918-920 looks like potential resi, but rsi is very low, almost OS, so we can short if it rejects from 920 range
in 5 min chart, both 34/89 ema is there
|
|
| Back to top |
|
|
singh.ravee
Yellow Belt
Joined: 12 Aug 2010
Posts: 678
|
| Post: #1558 Posted: Tue Feb 01, 2011 10:33 am Post subject: |
|
|
thnx casper for your prompt reply.
today could not trade any as failed to check charts yesterday night.
just now tried to put an order to short nf at 5488. nf felt bad and slipped to 5480 in a flash. uske baad mujhse door hi bhag raha hai. 
lets c if any other opportunity comes in the day.
regards
|
|
| Back to top |
|
|
sumesh_sol
Brown Belt

Joined: 06 Jun 2010
Posts: 2344
|
| Post: #1559 Posted: Tue Feb 01, 2011 11:22 am Post subject: BPCL 15TF |
|
|
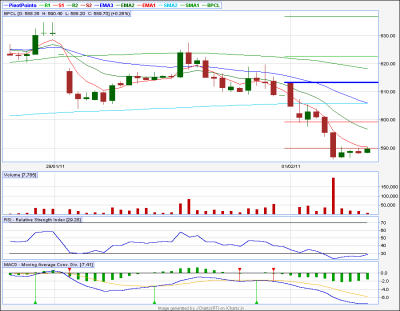
BPCL 15TF..
*****************
Though not getting much time from office chores( (: ) , still trying to make a trade in a day or two... Here isBPCL, making AT on 15 tf.. , I will go long above 592 for 596 & 590.... (MACD positive in 5tf...)
Let's see..
| Description: |
|
| Filesize: |
14.7 KB |
| Viewed: |
109 Time(s) |
|
|
|
| Back to top |
|
|
casper
Green Belt
Joined: 02 Oct 2010
Posts: 1315
|
| Post: #1560 Posted: Tue Feb 01, 2011 11:35 am Post subject: |
|
|
| singh.ravee wrote: | thnx casper for your prompt reply.
today could not trade any as failed to check charts yesterday night.
just now tried to put an order to short nf at 5488. nf felt bad and slipped to 5480 in a flash. uske baad mujhse door hi bhag raha hai.
lets c if any other opportunity comes in the day.
regards
|
try to buy nifty ravee with a sl below days low, we have + div in nifty now
|
|
| Back to top |
|
|
|


