|
|
| View previous topic :: View next topic |
| Author |
a layman's approach to break out and break down |
chetan83
Brown Belt

Joined: 19 Feb 2010
Posts: 2036
|
Post: #1576  Posted: Tue Feb 01, 2011 1:47 pm Post subject: Posted: Tue Feb 01, 2011 1:47 pm Post subject: |
 |
|
| casper wrote: | | chetan83 wrote: | | casper wrote: | | so u got 5465, |
No its 5478.. |
bhaiyyaa, aap to jante hain naa mere pass to srif basic charts hein,  |
Hi Casper,
But from basic chart you are getting ten fold benefit, whereas we using premium charts are getting more confused with many wipsaws...
We just want your guidance to survive here.
Thanks,
Chetan.
|
|
| Back to top |
|
 |
|
| |
girishhu1
White Belt

Joined: 17 Aug 2009
Posts: 316
|
| Post: #1577 Posted: Tue Feb 01, 2011 6:48 pm Post subject: |
|
|
hellow casperji,
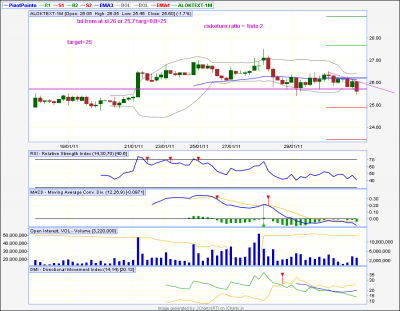
dt seen in alok textiles in 60 m tf. enclosing chart kindly confirm.
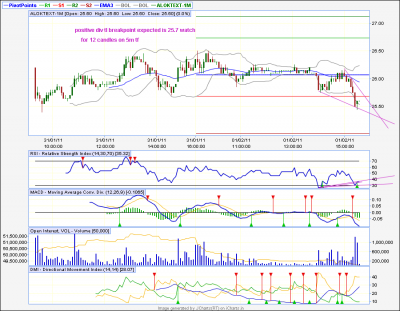
but at the same time positive divergence seen in 5 m tf enclosing chart . kindly advice how to trade these patterns tomorrow?
regards
girish
| Description: |
|
| Filesize: |
39.27 KB |
| Viewed: |
140 Time(s) |
|
| Description: |
|
| Filesize: |
51.52 KB |
| Viewed: |
146 Time(s) |
|
|
|
| Back to top |
|
|
singh.ravee
Yellow Belt

Joined: 12 Aug 2010
Posts: 678
|
| Post: #1578 Posted: Tue Feb 01, 2011 9:32 pm Post subject: |
|
|
casper bhai,
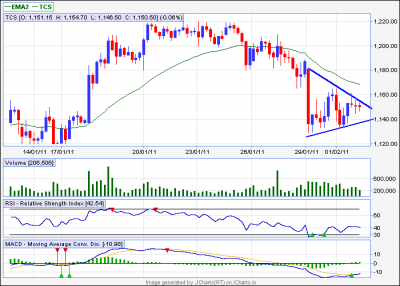
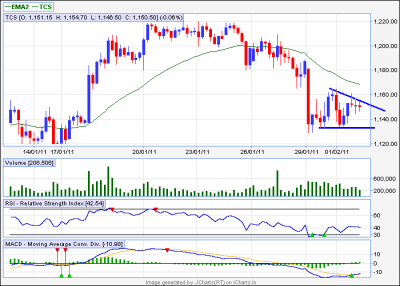
trying to draw triangles on tcs 60 min chart. i can see descending as well as symmetrical triangle in tcs.
i know one of them is appropriate. however dont know which one is appropriate.
kindly share your valuable observation.
in tcs eod, today's session has closed below hammer but still holding on to the support of window. any close below window will push it further down.
thanks and regards
ravee
| Description: |
|
| Filesize: |
12.79 KB |
| Viewed: |
129 Time(s) |
|
| Description: |
|
| Filesize: |
12.57 KB |
| Viewed: |
138 Time(s) |
|
|
|
| Back to top |
|
|
casper
Green Belt

Joined: 02 Oct 2010
Posts: 1315
|
| Post: #1579 Posted: Tue Feb 01, 2011 10:21 pm Post subject: |
|
|
| girishhu1 wrote: | hellow casperji,
dt seen in alok textiles in 60 m tf. enclosing chart kindly confirm.
but at the same time positive divergence seen in 5 m tf enclosing chart . kindly advice how to trade these patterns tomorrow?
regards
girish |
given the + div in 5 min chart on weekly s1 of 25.30 level, i think it will go up to 26 level and then, we need to to watch out for - div in 5 min tf or for a rejection form 26 level to short, in this case, we will be able to short it before actual bd
but if it goes above 26 then i dont think it will break down easily
|
|
| Back to top |
|
|
casper
Green Belt
Joined: 02 Oct 2010
Posts: 1315
|
| Post: #1580 Posted: Tue Feb 01, 2011 10:32 pm Post subject: |
|
|
| singh.ravee wrote: | casper bhai,
trying to draw triangles on tcs 60 min chart. i can see descending as well as symmetrical triangle in tcs.
i know one of them is appropriate. however dont know which one is appropriate.
kindly share your valuable observation.
in tcs eod, today's session has closed below hammer but still holding on to the support of window. any close below window will push it further down.
thanks and regards
ravee |
ravee bhai,
go with the st set up, i have identified this phenomenon in recent times,if u see ranbaxy post, and a few weeks ego, ABB post, u will see just same thing appeared to me and i, considering a dt, shorted on so called bd only to get my sl hit,
currently i have made a set of rules for this kinds of pattern after ranbaxy incident of yesterday (had to work all night ) and checked it in live market,
depending on that testing (u know,1 day testing is nothing) i expect it to go down, give a so called bd from so called dt and then go up suddenly
but, as i say, i am testing it, so cant be confident, but u better treat it as ST, at least, then u have both of the ways open to u and will go by pivots and ema levels to enter and exit
|
|
| Back to top |
|
|
casper
Green Belt
Joined: 02 Oct 2010
Posts: 1315
|
| Post: #1581 Posted: Tue Feb 01, 2011 10:35 pm Post subject: |
|
|
PS:
u know ravee, at first when i saw ur post, i just said "my god!! how did he know that i am working on it?"

|
|
| Back to top |
|
|
as4manju
White Belt
Joined: 22 Mar 2007
Posts: 390
|
| Post: #1582 Posted: Tue Feb 01, 2011 10:49 pm Post subject: |
|
|
Hi casper,
I would like to epress my view with ur permisson if u ask me which is more relaible regardless of what time frame (tra day or EOD) i would go with the first chart than the second one cause if u see the trendlines its covering more number of tops and bottoms so in my observation in trend lines i ve seen more the number of tops and bottoms cover by the trend better the result on BO or BD..
Regards
Manju
| casper wrote: | | singh.ravee wrote: | casper bhai,
trying to draw triangles on tcs 60 min chart. i can see descending as well as symmetrical triangle in tcs.
i know one of them is appropriate. however dont know which one is appropriate.
kindly share your valuable observation.
in tcs eod, today's session has closed below hammer but still holding on to the support of window. any close below window will push it further down.
thanks and regards
ravee |
ravee bhai,
go with the st set up, i have identified this phenomenon in recent times,if u see ranbaxy post, and a few weeks ego, ABB post, u will see just same thing appeared to me and i, considering a dt, shorted on so called bd only to get my sl hit,
currently i have made a set of rules for this kinds of pattern after ranbaxy incident of yesterday (had to work all night ) and checked it in live market,
depending on that testing (u know,1 day testing is nothing) i expect it to go down, give a so called bd from so called dt and then go up suddenly
but, as i say, i am testing it, so cant be confident, but u better treat it as ST, at least, then u have both of the ways open to u and will go by pivots and ema levels to enter and exit
|
|
|
| Back to top |
|
|
as4manju
White Belt
Joined: 22 Mar 2007
Posts: 390
|
| Post: #1583 Posted: Tue Feb 01, 2011 10:50 pm Post subject: |
|
|
Hi casper,
I would like to epress my view with ur permisson if u ask me which is more relaible regardless of what time frame (tra day or EOD) i would go with the first chart than the second one cause if u see the trendlines its covering more number of tops and bottoms so in my observation in trend lines i ve seen more the number of tops and bottoms cover by the trend better the result on BO or BD..
Regards
Manju
| casper wrote: | | singh.ravee wrote: | casper bhai,
trying to draw triangles on tcs 60 min chart. i can see descending as well as symmetrical triangle in tcs.
i know one of them is appropriate. however dont know which one is appropriate.
kindly share your valuable observation.
in tcs eod, today's session has closed below hammer but still holding on to the support of window. any close below window will push it further down.
thanks and regards
ravee |
ravee bhai,
go with the st set up, i have identified this phenomenon in recent times,if u see ranbaxy post, and a few weeks ego, ABB post, u will see just same thing appeared to me and i, considering a dt, shorted on so called bd only to get my sl hit,
currently i have made a set of rules for this kinds of pattern after ranbaxy incident of yesterday (had to work all night ) and checked it in live market,
depending on that testing (u know,1 day testing is nothing) i expect it to go down, give a so called bd from so called dt and then go up suddenly
but, as i say, i am testing it, so cant be confident, but u better treat it as ST, at least, then u have both of the ways open to u and will go by pivots and ema levels to enter and exit
|
|
|
| Back to top |
|
|
casper
Green Belt
Joined: 02 Oct 2010
Posts: 1315
|
| Post: #1584 Posted: Tue Feb 01, 2011 11:23 pm Post subject: |
|
|
hiii manju
u never need to ask for permission ever,
we all value ur comments and observation. and u r right, the 1st pattern, viz the ST version is stronger one
u know, in past i wrote to u that during intra we avoid ST/pennant due to its neutrality about the direction, so personally i, (may be others also) developed a habit to discount the shadows of a pattern to draw it as a AT/DT, it was a mistake from our side,
thats why, after getting sl hit, i am working out to find a suitable way out to trade it, and after setting up some rules, i am testing it with indicators so that we can trade it successfully just like an AT or DT
now, as the system is under testing, so i am not posting the rules, but i am sure if those rules proves to be correct, then we will have yet another weapon in our arsenal
|
|
| Back to top |
|
|
girishhu1
White Belt
Joined: 17 Aug 2009
Posts: 316
|
| Post: #1585 Posted: Wed Feb 02, 2011 12:28 am Post subject: |
|
|
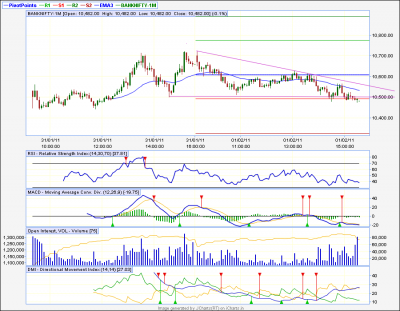
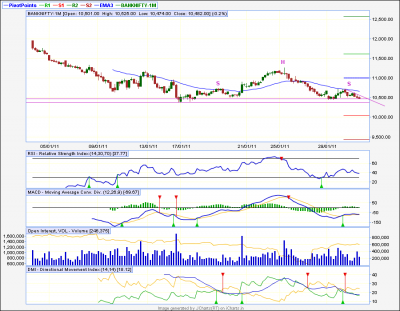
hellow casperji,
enclosing bknifty -1m chart. can u c hns pattern on 60m and st on 5m chart?
regards
girish
| Description: |
|
| Filesize: |
45.06 KB |
| Viewed: |
156 Time(s) |
|
| Description: |
|
| Filesize: |
40.63 KB |
| Viewed: |
141 Time(s) |
|
|
|
| Back to top |
|
|
girishhu1
White Belt
Joined: 17 Aug 2009
Posts: 316
|
| Post: #1586 Posted: Wed Feb 02, 2011 12:43 am Post subject: |
|
|
casperji
attaching 2 more charts- 1 bullish 1 bearish. kindly comment
regards
girish
| Description: |
|
| Filesize: |
51.6 KB |
| Viewed: |
155 Time(s) |
|
| Description: |
|
| Filesize: |
40.01 KB |
| Viewed: |
145 Time(s) |
|
|
|
| Back to top |
|
|
casper
Green Belt
Joined: 02 Oct 2010
Posts: 1315
|
| Post: #1587 Posted: Wed Feb 02, 2011 8:06 am Post subject: |
|
|
| girishhu1 wrote: | hellow casperji,
enclosing bknifty -1m chart. can u c hns pattern on 60m and st on 5m chart?
regards
girish |
yes bhaiyaa
very nice and timely finding
we are expecting a bottom out somewhere within this week, but in the light of ur posting, specially, for h/s. bank nifty is going to make new low, in that case, only GOD knows where we will find support
|
|
| Back to top |
|
|
casper
Green Belt
Joined: 02 Oct 2010
Posts: 1315
|
| Post: #1588 Posted: Wed Feb 02, 2011 8:34 am Post subject: |
|
|
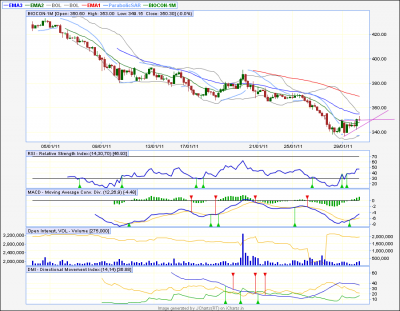
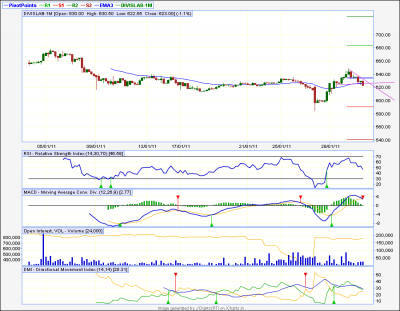
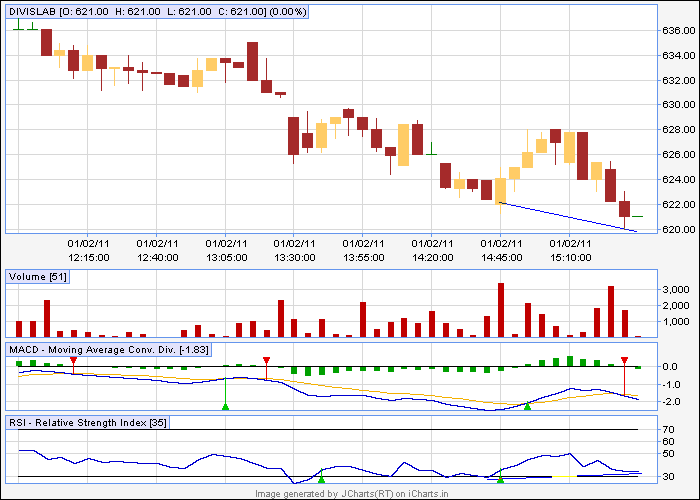
| girishhu1 wrote: | casperji
attaching 2 more charts- 1 bullish 1 bearish. kindly comment
regards
girish |
my basic chart of divis lab is bearish one, but my chart of biocon does not match with ur chart,so i am writing my view on divis only
its bearish ofcourse and weekly piv is supporting at 620
now i have a +div in 5 min chart, i think it will go up to 625 in cash to face resi and then will go down
however, we can sell it when it fall from 625 or even better can sell on a bd from weekly pivot of 620
| Description: |
|
| Filesize: |
10.17 KB |
| Viewed: |
598 Time(s) |
|
|
|
| Back to top |
|
|
sumesh_sol
Brown Belt
Joined: 06 Jun 2010
Posts: 2344
|
| Post: #1589 Posted: Wed Feb 02, 2011 9:59 am Post subject: KOTAK.. 5TF... |
|
|
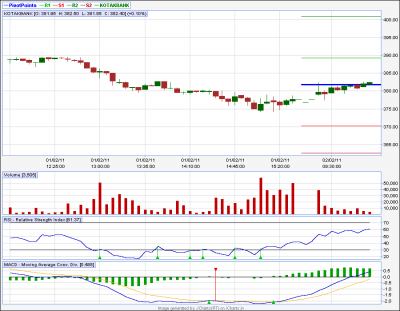
KOTAK.. 5TF...
AT BO .. above 383.. can touch 389..
-Sumesh
| Description: |
|
| Filesize: |
15.48 KB |
| Viewed: |
142 Time(s) |
|
|
|
| Back to top |
|
|
singh.ravee
Yellow Belt
Joined: 12 Aug 2010
Posts: 678
|
| Post: #1590 Posted: Wed Feb 02, 2011 10:36 am Post subject: |
|
|
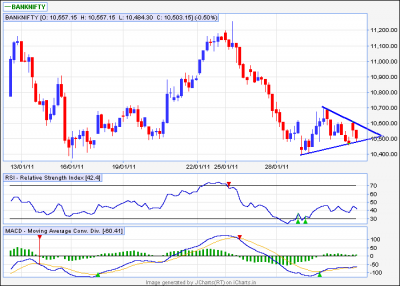
casper hello,
in bank nifty 60min a st is under formation, lets c which side it breaks out
thanks and regards
ravee
| Description: |
|
| Filesize: |
12.55 KB |
| Viewed: |
133 Time(s) |
|
|
|
| Back to top |
|
|
|
|
You cannot post new topics in this forum
You cannot reply to topics in this forum
You cannot edit your posts in this forum
You cannot delete your posts in this forum
You cannot vote in polls in this forum
You can attach files in this forum
You can download files in this forum
|
Powered by phpBB © 2001, 2005 phpBB Group
|
|
|


