| View previous topic :: View next topic |
| Author |
a layman's approach to break out and break down |
chetan83
Brown Belt

Joined: 19 Feb 2010
Posts: 2036
|
Post: #1591  Posted: Wed Feb 02, 2011 10:39 am Post subject: Posted: Wed Feb 02, 2011 10:39 am Post subject: |
 |
|
| singh.ravee wrote: | casper hello,
in bank nifty 60min a st is under formation, lets c which side it breaks out
thanks and regards
ravee |
Hi,
Hope to see BnF at 10460 min.
Rgards,
Chetan.
|
|
| Back to top |
|
 |
|
|
|
singh.ravee
Yellow Belt

Joined: 12 Aug 2010
Posts: 678
|
| Post: #1592 Posted: Wed Feb 02, 2011 10:39 am Post subject: |
|
|
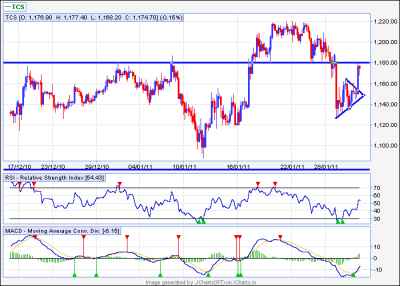
can it be considered as a breakout of tcs st on upside.
1180 is a previous support and hence now a resistance.
can we go short around 1180 level with 5 pts sl for tgt= tip of st= 1150 approx
or shall we wait for the stock to cross 1180 and then go long,
which do u think is a better strategy.
thanks and regards
ravee
| Description: |
|
| Filesize: |
15.27 KB |
| Viewed: |
125 Time(s) |
|
|
|
| Back to top |
|
|
casper
Green Belt

Joined: 02 Oct 2010
Posts: 1315
|
| Post: #1593 Posted: Wed Feb 02, 2011 10:58 am Post subject: |
|
|
| singh.ravee wrote: | casper hello,
in bank nifty 60min a st is under formation, lets c which side it breaks out
thanks and regards
ravee |
given a big h/s in bnf, neck line, as far as i recall, is 10400, i expect the bd instead,(only due to h/s, posted by girish bhaiyaa)
|
|
| Back to top |
|
|
anand1234
Yellow Belt
Joined: 17 Jul 2010
Posts: 830
|
| Post: #1594 Posted: Wed Feb 02, 2011 11:02 am Post subject: |
|
|
hi.....sumesh
great call kotakbank.....from 383 - 386.9.............
thanks boss
thanks
anjand
|
|
| Back to top |
|
|
casper
Green Belt
Joined: 02 Oct 2010
Posts: 1315
|
| Post: #1595 Posted: Wed Feb 02, 2011 11:09 am Post subject: |
|
|
| singh.ravee wrote: | can it be considered as a breakout of tcs st on upside.
1180 is a previous support and hence now a resistance.
can we go short around 1180 level with 5 pts sl for tgt= tip of st= 1150 approx
or shall we wait for the stock to cross 1180 and then go long,
which do u think is a better strategy.
thanks and regards
ravee |
1190 is weekly sup
if closes above that and without any - div, then forget shorting, buy wid a sl below 1190
but for any, i say again, any move, always check the div in 5 min chart, rsi should be rsi 14, not the default 21 of jchart,
21 will show up things a lil later,
|
|
| Back to top |
|
|
sumesh_sol
Brown Belt
Joined: 06 Jun 2010
Posts: 2344
|
| Post: #1596 Posted: Wed Feb 02, 2011 11:12 am Post subject: HDFC 15TF |
|
|
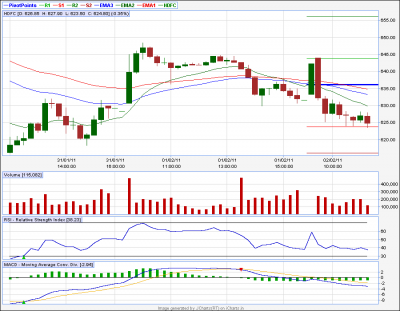
HDFC 15TF...
***************
DT.. Can be shorted below 623.. tgt could be 616...
-Sumesh
| Description: |
|
| Filesize: |
16.79 KB |
| Viewed: |
139 Time(s) |
|
|
|
| Back to top |
|
|
sumesh_sol
Brown Belt
Joined: 06 Jun 2010
Posts: 2344
|
| Post: #1597 Posted: Wed Feb 02, 2011 1:21 pm Post subject: HLL 60TF.... |
|
|
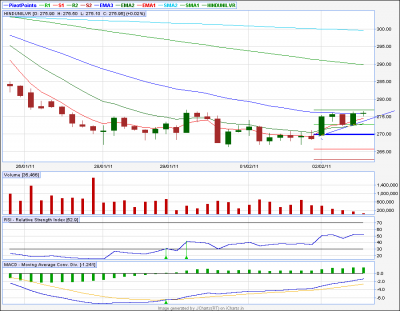
HLL 60TF....
*****************
AT in 60 tf..
Above 277 it can go upto 280 ....
-Sumesh
| Description: |
|
| Filesize: |
16.61 KB |
| Viewed: |
133 Time(s) |
|
|
|
| Back to top |
|
|
chetan83
Brown Belt
Joined: 19 Feb 2010
Posts: 2036
|
| Post: #1598 Posted: Wed Feb 02, 2011 1:38 pm Post subject: |
|
|
Hi Sumesh,
Long time, glad to see u back. How u see IOC on chart today, strugling to close abv monthly pvt.
Regards,
Chetan.
|
|
| Back to top |
|
|
singh.ravee
Yellow Belt
Joined: 12 Aug 2010
Posts: 678
|
| Post: #1599 Posted: Wed Feb 02, 2011 2:18 pm Post subject: |
|
|
casper bhai,
kindly look at st in banknifty 60min. if this current candle close above 10600 can we call it as a valid breakout.
regards
ravee
p.s.: intraday volume of banknifty is not available. how can v decide that its a high volume breakout?
|
|
| Back to top |
|
|
casper
Green Belt
Joined: 02 Oct 2010
Posts: 1315
|
| Post: #1600 Posted: Wed Feb 02, 2011 2:22 pm Post subject: |
|
|
| chetan83 wrote: | Hi Sumesh,
Long time, glad to see u back. How u see IOC on chart today, strugling to close abv monthly pvt.
Regards,
Chetan. |
asking sumesh bhai about indian oil?????

he will always say.... its good 
|
|
| Back to top |
|
|
casper
Green Belt
Joined: 02 Oct 2010
Posts: 1315
|
| Post: #1601 Posted: Wed Feb 02, 2011 2:30 pm Post subject: |
|
|
| singh.ravee wrote: | casper bhai,
kindly look at st in banknifty 60min. if this current candle close above 10600 can we call it as a valid breakout.
regards
ravee
p.s.: intraday volume of banknifty is not available. how can v decide that its a high volume breakout? |
yes in that case, it wil be a break out, but have to close above 34 ema also, i think its a lil higher than 10600.
and no chance to see the volume in any index, but we can check OI if u r premium member, or have to see it from nse website
(i never did so, so cant say if they update it candle to candle or not)
thumb rule is price increasing and OI increasing is good for fresh long and price is increasing, OI decreasing is a short covering rally
|
|
| Back to top |
|
|
popoy
White Belt

Joined: 18 Sep 2010
Posts: 18
|
| Post: #1602 Posted: Wed Feb 02, 2011 9:28 pm Post subject: |
|
|
| casper wrote: | | singh.ravee wrote: | casper bhai,
kindly look at st in banknifty 60min. if this current candle close above 10600 can we call it as a valid breakout.
regards
ravee
p.s.: intraday volume of banknifty is not available. how can v decide that its a high volume breakout? |
yes in that case, it wil be a break out, but have to close above 34 ema also, i think its a lil higher than 10600.
and no chance to see the volume in any index, but we can check OI if u r premium member, or have to see it from nse website
(i never did so, so cant say if they update it candle to candle or not)
thumb rule is price increasing and OI increasing is good for fresh long and price is increasing, OI decreasing is a short covering rally |
| Description: |
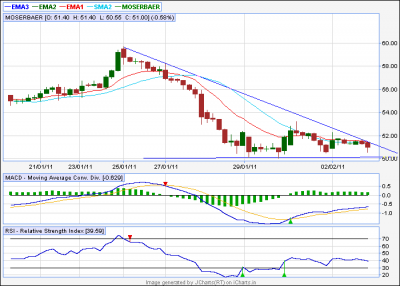
| moser bear 60 minute chart..... please comment is it a tradable one? |
|
| Filesize: |
12.55 KB |
| Viewed: |
132 Time(s) |
|
|
|
| Back to top |
|
|
casper
Green Belt
Joined: 02 Oct 2010
Posts: 1315
|
| Post: #1603 Posted: Wed Feb 02, 2011 10:07 pm Post subject: |
|
|
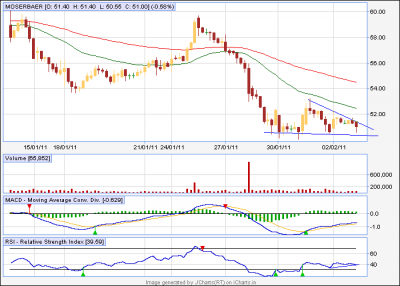
hi popoy
look at the chart i am posting, sell only on break down, but rsi is rising, so it may go up also
so if it goes up and breaks out the upper tl, we can buy with a sl on tl and target of 34 ema and weekly pivot point (52, 54)
| Description: |
|
| Filesize: |
12.67 KB |
| Viewed: |
142 Time(s) |
|
|
|
| Back to top |
|
|
singh.ravee
Yellow Belt
Joined: 12 Aug 2010
Posts: 678
|
| Post: #1604 Posted: Wed Feb 02, 2011 11:17 pm Post subject: |
|
|
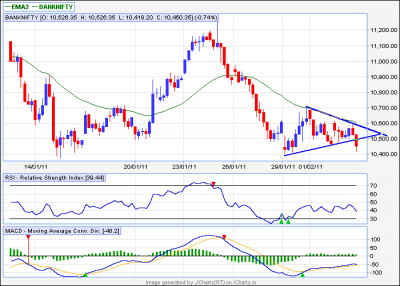
casper,
actual breakout in banknifty 60min is on down side. price again got rejected from 35ema= 10600. a good support is at 10370-10400.
i think below 10370 one can target around 200pts in banknifty.
regards
ravee
| Description: |
|
| Filesize: |
13.5 KB |
| Viewed: |
137 Time(s) |
|
|
|
| Back to top |
|
|
popoy
White Belt
Joined: 18 Sep 2010
Posts: 18
|
| Post: #1605 Posted: Thu Feb 03, 2011 8:01 am Post subject: |
|
|
| casper wrote: | hi popoy
look at the chart i am posting, sell only on break down, but rsi is rising, so it may go up also
so if it goes up and breaks out the upper tl, we can buy with a sl on tl and target of 34 ema and weekly pivot point (52, 54) |
thanks casper ji for moserbear
|
|
| Back to top |
|
|
|


