|
|
| View previous topic :: View next topic |
| Author |
a layman's approach to break out and break down |
vishytns
White Belt

Joined: 26 Nov 2009
Posts: 206
|
Post: #166  Posted: Sun Nov 07, 2010 10:48 pm Post subject: Posted: Sun Nov 07, 2010 10:48 pm Post subject: |
 |
|
Casper,
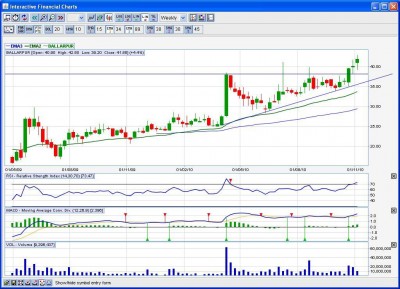
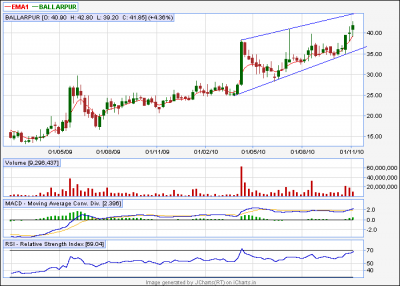
Ballarpur in weekly charts broke out an ascending triangle. Not sure again if it is in the channel.
Post your views.
Vishy
| Description: |
|
| Filesize: |
133.63 KB |
| Viewed: |
359 Time(s) |
|
|
|
| Back to top |
|
 |
|
|  |
vishytns
White Belt

Joined: 26 Nov 2009
Posts: 206
|
Post: #167  Posted: Sun Nov 07, 2010 10:56 pm Post subject: Posted: Sun Nov 07, 2010 10:56 pm Post subject: |
 |
|
Casper,
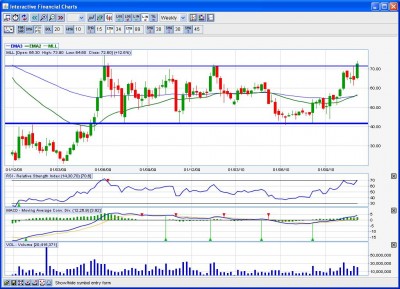
Mercator Lines(MLL) shows that it has broken out of a Rectangle Pattern (Channel). One more day with green candle and good volumes would confirm it. Let me know your views.
Vishy
| Description: |
|
| Filesize: |
141.75 KB |
| Viewed: |
383 Time(s) |
|
|
|
| Back to top |
|
 |
vishytns
White Belt

Joined: 26 Nov 2009
Posts: 206
|
Post: #168  Posted: Sun Nov 07, 2010 11:03 pm Post subject: Posted: Sun Nov 07, 2010 11:03 pm Post subject: |
 |
|
Casper,
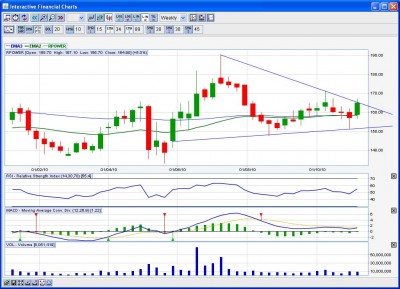
One more stock with Symmetrical Triangle.
RPOWER.
Vishy
| Description: |
|
| Filesize: |
128.57 KB |
| Viewed: |
377 Time(s) |
|
|
|
| Back to top |
|
 |
vishytns
White Belt

Joined: 26 Nov 2009
Posts: 206
|
|
| Back to top |
|
 |
casper
Green Belt

Joined: 02 Oct 2010
Posts: 1315
|
Post: #170  Posted: Mon Nov 08, 2010 8:00 am Post subject: Posted: Mon Nov 08, 2010 8:00 am Post subject: |
 |
|
| vishytns wrote: | Casper,
Your views on GMRINFRA. Is it taking the support or ready to break down forming a descending triangle. You would love to do analysis on this. Provide your views on this as well.
I think this is enough for today. You have lots of work in tommorow's morning session. 
Vishy |
work is complete vishy 
here is the results
gmrinfra: its currently at support level, but the descending triangle is already formed,a break down from here will reach us to rupees 10 levels,
(high93- support 53)= price movement 40
price target= bd point- price movemet=53-40=13
its an weekly chart so it will take time to reach the target, but its surely an early warning of a possible tragedy
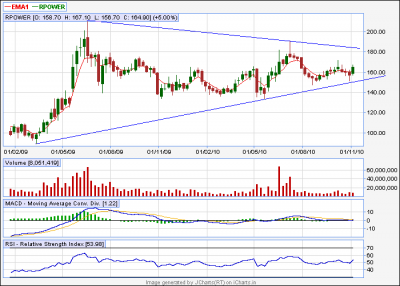
r power: a sym. triangle with decreased vol, a bo/bd will take us up to 110 rupees from bo/bd point, bo point is 180-190, while bd point is 150
the drawing of chart will be a lil diff, i have posted it
mll: i second ur view
ballar pur: here i will call it a channel,because in case of a ascending triangle bo, we dont have a large candle wid increased vol, so its not a proper bo, if we think it as a channel, then we will have a bo pint around 50 level, so the present case of normal vol and small real body can be explined
ibrealest: its a ascending traingle, i have seen in higher tfs like 20/30/60 min tf, all shows it as a ascending triangle, it has a minimum target of 210 aprx
| Description: |
|
| Filesize: |
12.85 KB |
| Viewed: |
370 Time(s) |
|
| Description: |
|
| Filesize: |
12.47 KB |
| Viewed: |
369 Time(s) |
|
|
|
| Back to top |
|
 |
newinvestor
White Belt

Joined: 16 Feb 2010
Posts: 120
|
Post: #171  Posted: Mon Nov 08, 2010 8:27 am Post subject: Posted: Mon Nov 08, 2010 8:27 am Post subject: |
 |
|
Casper, Good Morning.
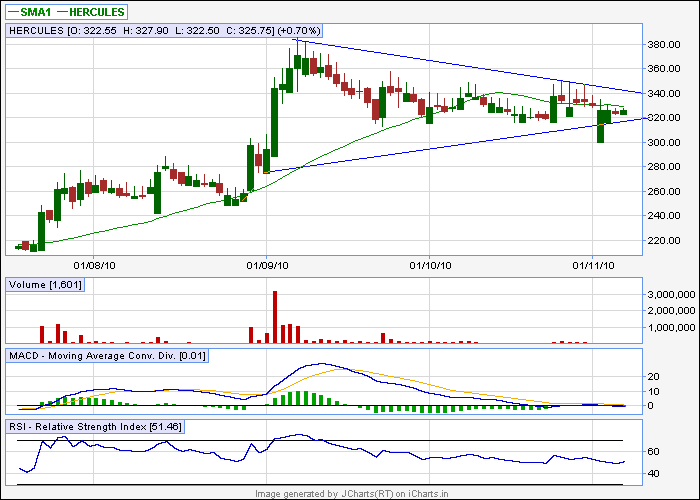
What do you think of Hercules Hoist? Seems it broke out of the Cup, and now forming a handle (or pennant) . Can one make an entry with a S/L of 310?
As it is retracing, maybe a breakout above 320 can take it to 380 atleast?
|
|
| Back to top |
|
 |
casper
Green Belt

Joined: 02 Oct 2010
Posts: 1315
|
Post: #172  Posted: Mon Nov 08, 2010 8:58 am Post subject: Posted: Mon Nov 08, 2010 8:58 am Post subject: |
 |
|
good moring newinvestor,
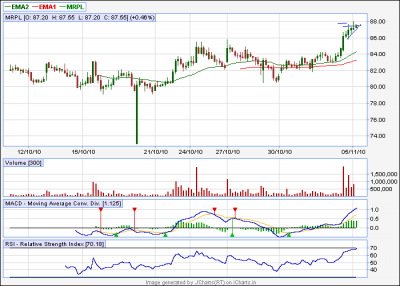
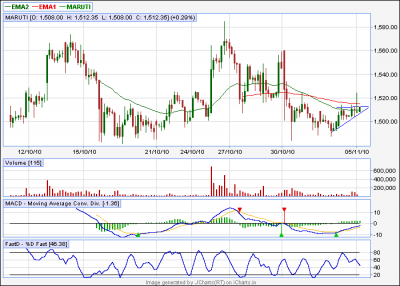
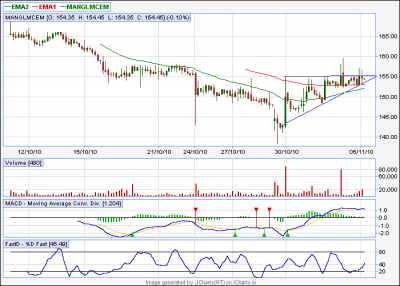
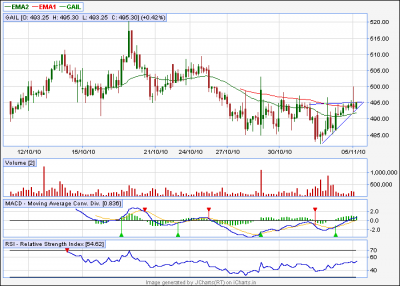
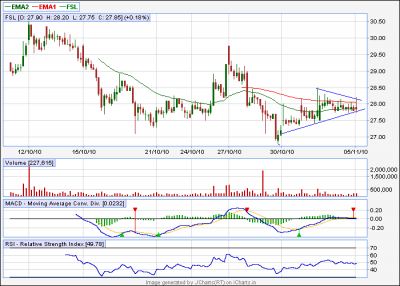
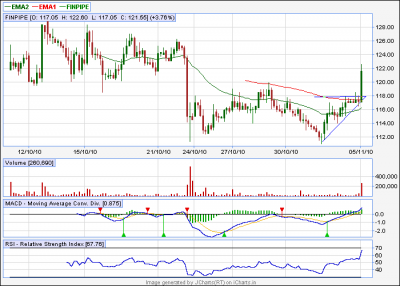
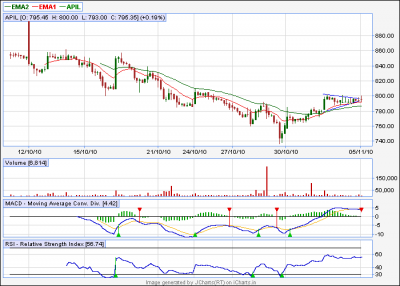
i will check and post it, now going to post what i found using real time chart for today, from eod price vol expansion list, i did not find any convincing patterns and also i want see how the indicators react during a true and a false
bo, so i concentrated upon rt charts, here i have used a 60 min tf
mrpl: ascending traingle, target 89-90
apil= target 820. sym tri
finpipe= already bo, ascndng tri , target 128.130
fsl= sym tri , target 31.50
gail= ascndg tri, target 500.505.510
manglmcem= ascendiong tri. target 160.162
maruti target 1530
| Description: |
|
| Filesize: |
12.83 KB |
| Viewed: |
387 Time(s) |
|
| Description: |
|
| Filesize: |
14.12 KB |
| Viewed: |
391 Time(s) |
|
| Description: |
|
| Filesize: |
13.46 KB |
| Viewed: |
382 Time(s) |
|
| Description: |
|
| Filesize: |
13.68 KB |
| Viewed: |
372 Time(s) |
|
| Description: |
|
| Filesize: |
13.14 KB |
| Viewed: |
401 Time(s) |
|
| Description: |
|
| Filesize: |
13.46 KB |
| Viewed: |
375 Time(s) |
|
| Description: |
|
| Filesize: |
13.14 KB |
| Viewed: |
379 Time(s) |
|
|
|
| Back to top |
|
 |
casper
Green Belt

Joined: 02 Oct 2010
Posts: 1315
|
Post: #173  Posted: Mon Nov 08, 2010 9:06 am Post subject: Posted: Mon Nov 08, 2010 9:06 am Post subject: |
 |
|
| newinvestor wrote: | Casper, Good Morning.
What do you think of Hercules Hoist? Seems it broke out of the Cup, and now forming a handle (or pennant) . Can one make an entry with a S/L of 310?
As it is retracing, maybe a breakout above 320 can take it to 380 atleast? |
if u want to take a normal short term position u can enter here wid a target of 340, sl should be 320 by closing
if u want to trade it as a bo, wait up to a convincing break out above 340, in that case we will have a target of 380.400.415.440
| Description: |
|
| Filesize: |
10.96 KB |
| Viewed: |
1859 Time(s) |
|
|
|
| Back to top |
|
 |
casper
Green Belt

Joined: 02 Oct 2010
Posts: 1315
|
Post: #174  Posted: Mon Nov 08, 2010 8:36 pm Post subject: Posted: Mon Nov 08, 2010 8:36 pm Post subject: |
 |
|
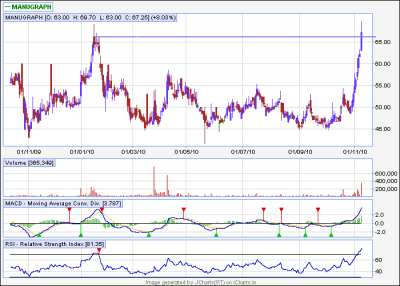
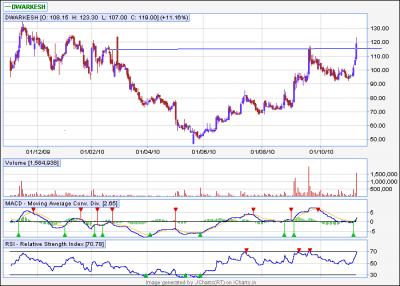
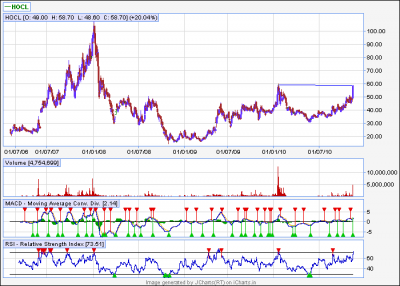
a few charts which may rock in coming days
1.hocl= rounding bottom is complete, will it consolidate or zoom straightaway?
target 85-90
2.dwarkesh= cup and handle formation complete, will it rock? target 150
3.manugraph= rounding bottom complete, amy consolidate to form a handle or may go upward, target 85
| Description: |
|
| Filesize: |
14.38 KB |
| Viewed: |
375 Time(s) |
|
| Description: |
|
| Filesize: |
14.48 KB |
| Viewed: |
365 Time(s) |
|
| Description: |
|
| Filesize: |
17.11 KB |
| Viewed: |
387 Time(s) |
|
|
|
| Back to top |
|
 |
mrvishal_g
White Belt

Joined: 17 Sep 2010
Posts: 89
|
Post: #175  Posted: Mon Nov 08, 2010 10:29 pm Post subject: Posted: Mon Nov 08, 2010 10:29 pm Post subject: |
 |
|
Hi Casper,
I just search some stock
JP Associate 138.15...... buy in white candle with a stop loss open price -1 target 145-148
Voltas 258.55........Buy target 270-275,280 sl 250 on closing basis(positional call)
Ashok Leyland 80.55........buy T-86 sl 79
HCC 63.4 i am already holding a lot in f&o today candle in HCC is showing that tom it can hit 65 atleast.(may be gap up opening)
Please comment
Vishal 
|
|
| Back to top |
|
 |
casper
Green Belt

Joined: 02 Oct 2010
Posts: 1315
|
Post: #176  Posted: Tue Nov 09, 2010 7:40 am Post subject: Posted: Tue Nov 09, 2010 7:40 am Post subject: |
 |
|
hi vishal, good morning,
jpassocait is alright, it has reached the mild resistance which i mentioned sunday, above it, there is practically no strong resistance upto 150
in case of voltas, i would only add that 260-265 is the level where saucer formation will be finished, if it breaches this level and shows 280, then just hold it for a mid term, if the uptrend continues then we may get around 400 in coming days with some consolidation phase which will come and go
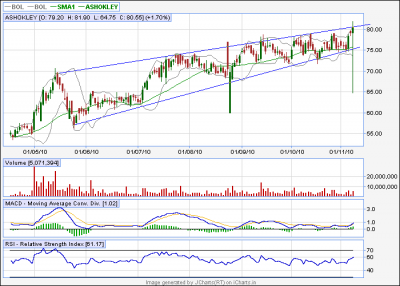
ashokley is a strong uptrend, but here is prb, it has reached the upper bollinger and the upper tl of a channel (in future,may develop wedge also)
if it sustain above 80 then target is very much possible, but the question is, it has to break upper tl as well as bollinger band to sustain there (i think its result is pending, i dont know exact date, but may be 2day or 2mrrw, if 2day is result then plz be careful, it may react in some crazy manner)
in case of hcc, bollinger (9) hows a target of 65 while bollinger (20,2) shows 68, it has cleared a few strong resistance yesterday and in spite of bearish day, it closed at doji suggesting market's confidence in this stock, so we can expect a good move today, any if it sustain above 65, then we will have no barrier up to 68
| Description: |
|
| Filesize: |
16.14 KB |
| Viewed: |
378 Time(s) |
|
|
|
| Back to top |
|
 |
mrvishal_g
White Belt

Joined: 17 Sep 2010
Posts: 89
|
Post: #177  Posted: Tue Nov 09, 2010 8:44 am Post subject: Posted: Tue Nov 09, 2010 8:44 am Post subject: |
 |
|
| Thanks for comment
|
|
| Back to top |
|
 |
casper
Green Belt

Joined: 02 Oct 2010
Posts: 1315
|
Post: #178  Posted: Tue Nov 09, 2010 8:55 am Post subject: Posted: Tue Nov 09, 2010 8:55 am Post subject: |
 |
|
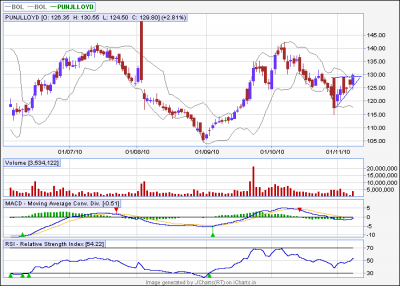
punjlloyd, has a strong resistance at 130 as the upper tl and bollinger band intersect here, a break out above will take to 145.
| Description: |
|
| Filesize: |
14.03 KB |
| Viewed: |
401 Time(s) |
|
|
|
| Back to top |
|
 |
anand1234
Yellow Belt

Joined: 17 Jul 2010
Posts: 830
|
Post: #179  Posted: Tue Nov 09, 2010 1:26 pm Post subject: Posted: Tue Nov 09, 2010 1:26 pm Post subject: |
 |
|
hi...........casper
....I bought hocl @59..........&................ dwarkesh@119..........both r so down ...............any reson??..............how long shd I hold??...........pls guide me
thanks
anand
|
|
| Back to top |
|
 |
newinvestor
White Belt

Joined: 16 Feb 2010
Posts: 120
|
Post: #180  Posted: Tue Nov 09, 2010 3:06 pm Post subject: Posted: Tue Nov 09, 2010 3:06 pm Post subject: |
 |
|
One of my friends told me that his Broker is recommending ICSA.
When I checked the 3 yr charts, it seems like waiting for a big break out.
What do you feel?
|
|
| Back to top |
|
 |
|
|
You cannot post new topics in this forum
You cannot reply to topics in this forum
You cannot edit your posts in this forum
You cannot delete your posts in this forum
You cannot vote in polls in this forum
You can attach files in this forum
You can download files in this forum
|
Powered by phpBB © 2001, 2005 phpBB Group
|
|
|

