|
|
| View previous topic :: View next topic |
| Author |
a layman's approach to break out and break down |
casper
Green Belt

Joined: 02 Oct 2010
Posts: 1315
|
Post: #1726  Posted: Mon Feb 07, 2011 1:45 pm Post subject: Posted: Mon Feb 07, 2011 1:45 pm Post subject: |
 |
|
| by da way, all i am commenting with a view of intraday and may be for a btst horizon, if u have any other time frame, plz let me know with ur questions
|
|
| Back to top |
|
 |
|
|  |
casper
Green Belt

Joined: 02 Oct 2010
Posts: 1315
|
Post: #1727  Posted: Mon Feb 07, 2011 1:49 pm Post subject: Posted: Mon Feb 07, 2011 1:49 pm Post subject: |
 |
|
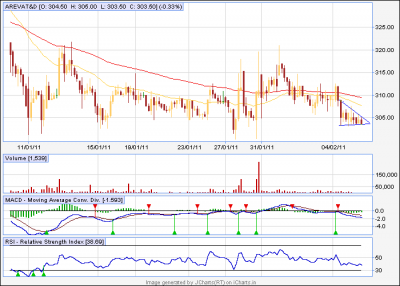
areva t&d
a dt is going to break down
below 303 it can go down for 5 rupees
wait for bd to happen by candle close and sell with a sl above 303 by closing in 60 min tf
| Description: |
|
| Filesize: |
14.1 KB |
| Viewed: |
183 Time(s) |
|
|
|
| Back to top |
|
 |
technocalls
White Belt

Joined: 27 Aug 2010
Posts: 34
|
Post: #1728  Posted: Mon Feb 07, 2011 8:41 pm Post subject: Posted: Mon Feb 07, 2011 8:41 pm Post subject: |
 |
|
hi,
today again it was a positive opening and in the end back to yestday closing ....jaha se suru hue vahi ve vapas aa gire....i thing nifty is in range of 100 point 5350-5450...... the breakout/break down will decide the further trend
|
|
| Back to top |
|
 |
bassan
White Belt

Joined: 01 Dec 2009
Posts: 57
|
Post: #1729  Posted: Mon Feb 07, 2011 9:19 pm Post subject: TATASTEEL-daily chart Posted: Mon Feb 07, 2011 9:19 pm Post subject: TATASTEEL-daily chart |
 |
|
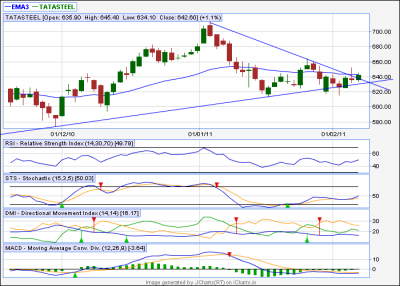
Hi Casper,
Your view on tatasteel pls.
| Description: |
|
| Filesize: |
35.76 KB |
| Viewed: |
196 Time(s) |
|
| Description: |
|
| Filesize: |
35.76 KB |
| Viewed: |
156 Time(s) |
|
|
|
| Back to top |
|
 |
casper
Green Belt

Joined: 02 Oct 2010
Posts: 1315
|
Post: #1730  Posted: Mon Feb 07, 2011 10:33 pm Post subject: Re: TATASTEEL-daily chart Posted: Mon Feb 07, 2011 10:33 pm Post subject: Re: TATASTEEL-daily chart |
 |
|
| bassan wrote: | Hi Casper,
Your view on tatasteel pls. |
hi bassan
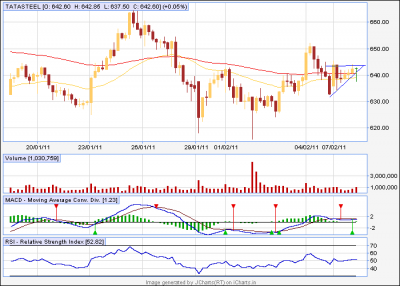
looking at the dozi candle, cant say it good break out,
now in 60 min tf, an at is forming, 644 is going to be the bo level
above which weekly s1 at 651 and monthly piv at 655 can be our targets
| Description: |
|
| Filesize: |
12.91 KB |
| Viewed: |
182 Time(s) |
|
|
|
| Back to top |
|
 |
ESNMURTY
White Belt

Joined: 31 Oct 2009
Posts: 380
|
Post: #1731  Posted: Mon Feb 07, 2011 10:52 pm Post subject: Posted: Mon Feb 07, 2011 10:52 pm Post subject: |
 |
|
| Dear Casper, what is your view on DIVISLAB
|
|
| Back to top |
|
 |
bassan
White Belt

Joined: 01 Dec 2009
Posts: 57
|
Post: #1732  Posted: Mon Feb 07, 2011 11:10 pm Post subject: Posted: Mon Feb 07, 2011 11:10 pm Post subject: |
 |
|
| Thanks Casper
|
|
| Back to top |
|
 |
casper
Green Belt

Joined: 02 Oct 2010
Posts: 1315
|
Post: #1733  Posted: Tue Feb 08, 2011 8:12 am Post subject: Posted: Tue Feb 08, 2011 8:12 am Post subject: |
 |
|
| ESNMURTY wrote: | | Dear Casper, what is your view on DIVISLAB |
hiii
it was some what a dt, which broken down and almost made its target, now as 642 is weekly level and 640 is 34 ema in 60 min chart, so i expect this range to be a strong support
and one more thing, in my experience, i have seen that after once reaching the target, (its target was aprox 10 rs) price tends to bounce back on short covering or some times, becomes choppy
so its not a sell any more, but if it breaks below 642-640 range with a candle close in 60 min tf, then we can expect a further gradual down moves up to 633 level which is monthly pivot
even, we should check it if it becomes choppy at the support zone, in that case we can buy it with a + div in 5 min tf for an intra up move
|
|
| Back to top |
|
 |
casper
Green Belt

Joined: 02 Oct 2010
Posts: 1315
|
Post: #1734  Posted: Tue Feb 08, 2011 9:23 am Post subject: Posted: Tue Feb 08, 2011 9:23 am Post subject: |
 |
|
| bassan wrote: | | Thanks Casper |
thanks bassan
ATTENTION BEGINNERS!!!!
all,
nowadays i see more and more new peoples are actively participating in our style of break out trading, its my honor but my responsibility too,so its necessary to explain them our basic criteria of break outs,
the test and its results along with failure trades, what i submitted in the forum, is almost non-reachable, now we have 174 pages and i, myself dont know at which page those reports are posted, last time when i tried to find them for chetan bhaiyya, it took one hour of active search!!!
so now, here i sum up the basic idea of break outs and break down in our way, plz go through them, and if u find any questions then dont hesitate to ask
1. we will search only for At and DT. ascending triangles and descending triangles respectively, at this stage, we will not trade ST as it does not gives us a directional bias, (we are underway to develop rules for st trading, i will publish them soon)
2.we normally trade in 60 min tf, we can, however, trade in any tf, but we choose the 60 only for less whipsaw and a good, reliable break outs
3.we try to validate the bo/bd with macd and rsi
4. for a bo, we wud expect macd to be in buy mode and rsi rising BUT not overbought
whereas, in lesser tfs, i saw some times macd comes in buy mode later and bo coming fisrt, but for 60 tf , macd should be in buy mode, or else we are likely to have a fake out or one candle break out
some times after a heavy crash, during bottoming out and pull backs, we see even in 60 min, macd is not in buy mode but at is forming and breaking out
in that cases only, we have to rely on the macd histograms, if we see that macd histogram's negative or sell cycle is gradually decreasing, we can conclude this as a some what bullish conditions and we can trade it too
but dont apply it for a normal bo, its use is only confined to the bottoming out procedure only
5. same. for a DT, we wud expect the macd to be in sell mode and rsi decreasing but not oversold, and during topping out procedure we can maneuver with macd a little. but this too, will be limited to the topping out procedure only
6.34. 89 ema and monthly, weekly pivots and r1/r2, s1/s2 are really strong levels to be broken easily, so we will use them as our target or stop loss, if any one wants a pictorial representations of this target/sl idea with aforesaid levels, he/she can check this thread, in almost every case, we have used them as our targets or sls, and we dont bother about daily pivots as we can break them easily with our set ups
7.in a normal condition, we buy/sell with 60 min candle close, means we wud wait until the bo/bd happens with a candle close and then we will buy /sell it
in that case, we will use a candle close below/above bo/bd level as our stop loss
8.some times, we will see that the bo/bd candle,due to heavy market momentum, is reaching almost 50-75% target of our bo/bd
in that case, we have to check it quickly in smaller tf, up to that smaller tf where the same set up is available and take position with a candle close with favorable macd/rsi in smaller tf
becoz, when we see an AT or a DT in 60min, its very likely that same setup, with more number of candles (due to lesser tf, lesser tf means more candle) will be present in 30/20/15 min and so on
this however, an aggressive method and not suitable for conservative traders, bcoz a momentum buy/sell can make huge gain and at the same time, can cause u huge loss as well
when i first concluded this style, i gave more and more importance on macd, but as time goes on, now i am realizing the importance of rsi too, and at this stage, when i am writing this, i feel rsi is equally important for a true bo/bd
so i wud request u to study about macd and rsi in some depth to get the total juice form a set up
if u find it hard to understand, then plz let me know, i will write about it
nowadays im busy like hell with more and more fine tuning as some of the loopholes, specifically during too volatile times, like nifty crashing and so on, has been noticed by me and i am working on it to fix them, so at times i may become absent in the forum, in these days, plz do wait, i will always be back to reply u, may be a lil later, but i will reply for sure
so that was a summary of what we are trying to do with these set ups,
happy trading
  
|
|
| Back to top |
|
 |
sumesh_sol
Brown Belt

Joined: 06 Jun 2010
Posts: 2344
|
Post: #1735  Posted: Tue Feb 08, 2011 10:07 am Post subject: herohonda 15TF Posted: Tue Feb 08, 2011 10:07 am Post subject: herohonda 15TF |
 |
|
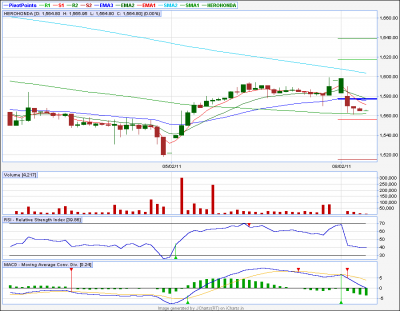
Herohonda 15TF
*****************
DT..
Break below 1560 can test 1540 / 1520..
-Sumesh
| Description: |
|
| Filesize: |
15.08 KB |
| Viewed: |
483 Time(s) |

|
| Description: |
|
| Filesize: |
15.08 KB |
| Viewed: |
214 Time(s) |
|
|
|
| Back to top |
|
 |
anand1234
Yellow Belt

Joined: 17 Jul 2010
Posts: 830
|
Post: #1736  Posted: Tue Feb 08, 2011 10:26 am Post subject: Posted: Tue Feb 08, 2011 10:26 am Post subject: |
 |
|
hi.........sumesh
welcome back.........any s/l for herohomda for intra??
thanks
anand
|
|
| Back to top |
|
 |
sumesh_sol
Brown Belt

Joined: 06 Jun 2010
Posts: 2344
|
Post: #1737  Posted: Tue Feb 08, 2011 10:28 am Post subject: Posted: Tue Feb 08, 2011 10:28 am Post subject: |
 |
|
| anand1234 wrote: | hi.........sumesh
welcome back.........any s/l for herohomda for intra??
thanks
anand |
My SL is 1567..
|
|
| Back to top |
|
 |
sumesh_sol
Brown Belt

Joined: 06 Jun 2010
Posts: 2344
|
Post: #1738  Posted: Tue Feb 08, 2011 10:33 am Post subject: Sunpharma..5tf.. Posted: Tue Feb 08, 2011 10:33 am Post subject: Sunpharma..5tf.. |
 |
|
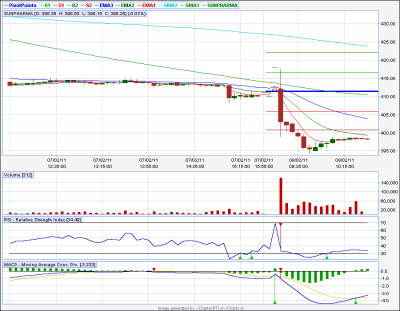
Sunpharma..5tf..
********************
I have kept a buy order above 400 for tgt of 405 (Sl below 397)
Also, a sell order below 397 for tgt of 392 (Sl above 400)
Let's see..
-Sumesh
| Description: |
|
| Filesize: |
17.97 KB |
| Viewed: |
212 Time(s) |
|
|
|
| Back to top |
|
 |
sumesh_sol
Brown Belt

Joined: 06 Jun 2010
Posts: 2344
|
Post: #1739  Posted: Tue Feb 08, 2011 10:54 am Post subject: Posted: Tue Feb 08, 2011 10:54 am Post subject: |
 |
|
| sumesh_sol wrote: | | anand1234 wrote: | hi.........sumesh
welcome back.........any s/l for herohomda for intra??
thanks
anand |
My SL is 1567.. |
I have booked 70% ... rest for 1520 (Sl trailed to 1550...)
|
|
| Back to top |
|
 |
sumesh_sol
Brown Belt

Joined: 06 Jun 2010
Posts: 2344
|
Post: #1740  Posted: Tue Feb 08, 2011 11:03 am Post subject: Re: Sunpharma..5tf.. Posted: Tue Feb 08, 2011 11:03 am Post subject: Re: Sunpharma..5tf.. |
 |
|
| sumesh_sol wrote: | Sunpharma..5tf..
********************
I have kept a buy order above 400 for tgt of 405 (Sl below 397)
Also, a sell order below 397 for tgt of 392 (Sl above 400)
Let's see..
-Sumesh |
It is looking good for 410 and even 415... I have placed another buy above 401.. with STRICT SL below 397
|
|
| Back to top |
|
 |
|
|
You cannot post new topics in this forum
You cannot reply to topics in this forum
You cannot edit your posts in this forum
You cannot delete your posts in this forum
You cannot vote in polls in this forum
You can attach files in this forum
You can download files in this forum
|
Powered by phpBB © 2001, 2005 phpBB Group
|
|
|

