|
|
| View previous topic :: View next topic |
| Author |
a layman's approach to break out and break down |
ali522003
White Belt

Joined: 03 Jul 2010
Posts: 217
|
Post: #1801  Posted: Wed Feb 09, 2011 4:08 pm Post subject: Posted: Wed Feb 09, 2011 4:08 pm Post subject: |
 |
|
| sumesh_sol wrote: | | ali522003 wrote: | | sumesh_sol wrote: | | sumesh_sol wrote: | | ali522003 wrote: | sumesh bhai ,, reddy falling sharply.. are u holding,, i m still hoding it.. waiting for a upmove,,  |
For a trader, it is extremely important to maintain a sea like calmness while executing his/her trades... Once you take a trade , decide upon Tgt /SL , stick to them...
I have decided for breach of low of BB in 60 tf.. whatever is the value that time , I will exit.... |
I exited at *1510* after seeing BB breaking down .... |
i m carrying tatapower and dr reddy both.. will try to cut tomorrow.. wat should be the stop of reddy, sumesh bhai.. |
This is what frustrate us.... 
Ali bhai, please try to understand, there is logic behind every trade you take and since you were following my trade, you should have followed my SL also..... !!!
Hope & Prayers have no place in trading world, one should be disciplined while doing any trade... EGO of not accepting a loss is "the biggest" factor in men's failure in trading... New people (and I'm not excluded) generally trade for a sense of winning , pride and when they see thier position going against their will they just behave like Ostrich...
Now this message is not just for you, it is a reminder for every person doing short term trading in this cruel world of stock market.
Drreddy is now looking very weak, if tomorrow mkt gives you some chance to minimise your loss then use that or else just come out.. On EOD chart also it has not taken support at 200 SMA. With my limited TA I can say "please book your loss now". I would be happy if anyone else can throw some more light on this....
Tatapower is going strong and seems it will break HnS which I mentioned in yesrterday's post also.. so watch out for 1240 level, if it crosses convincingly then 1300 is also achievable... |
Bhai i did one mail to you. Please reply to tht.
|
|
| Back to top |
|
 |
|
|  |
technocalls
White Belt

Joined: 27 Aug 2010
Posts: 34
|
Post: #1802  Posted: Thu Feb 10, 2011 12:32 am Post subject: Posted: Thu Feb 10, 2011 12:32 am Post subject: |
 |
|
hi casper,
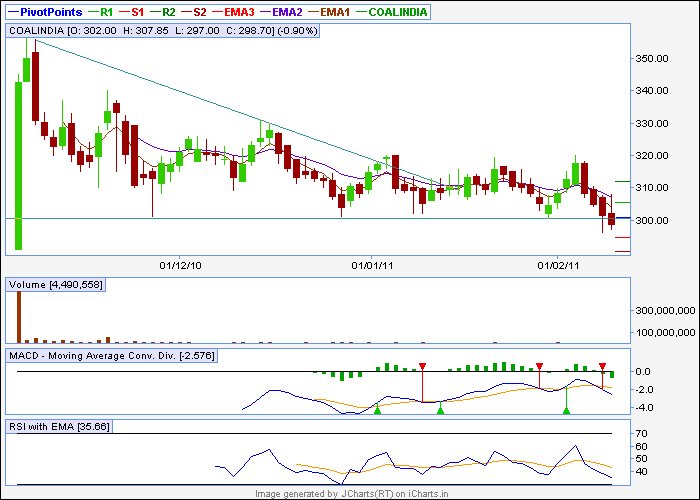
today coal india fail to close abv 300.i thing good support was broken....does the stock fall further..?????how to claculate trager and SL where less data is avlble..
one more thing i want to ask u what is rising wedge and folling wedge ???? have u explain it in any of ur prvs post???....if not then plz explain it when ever u get time.
regards,
| Description: |
|
| Filesize: |
10.09 KB |
| Viewed: |
708 Time(s) |
|
|
|
| Back to top |
|
 |
technocalls
White Belt

Joined: 27 Aug 2010
Posts: 34
|
Post: #1803  Posted: Thu Feb 10, 2011 12:56 am Post subject: Posted: Thu Feb 10, 2011 12:56 am Post subject: |
 |
|
hi again
i want to share u and ask u abt two stocks
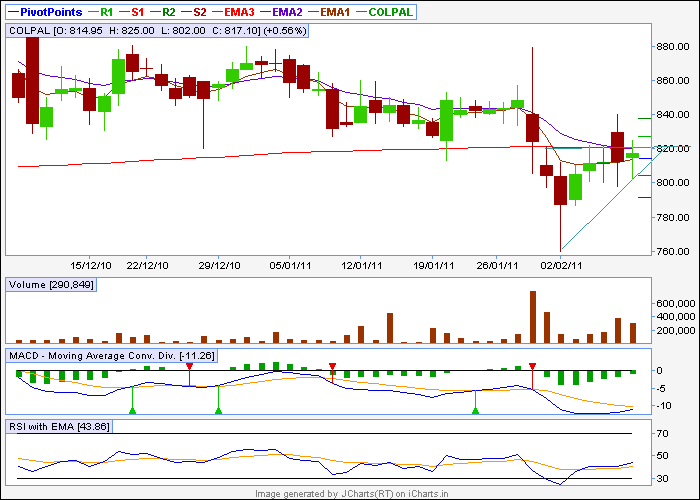
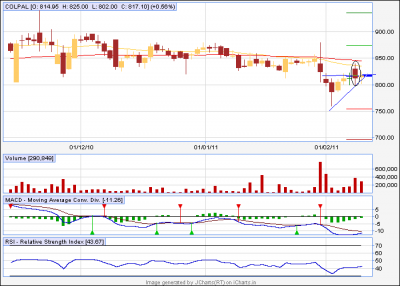
colpal - its AT .... i m not good in trget and SL in trigles so casper will help
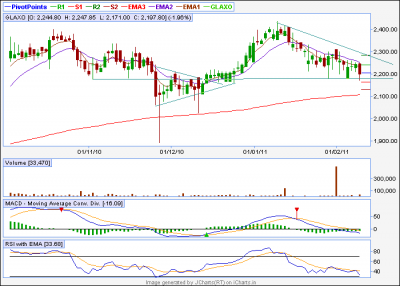
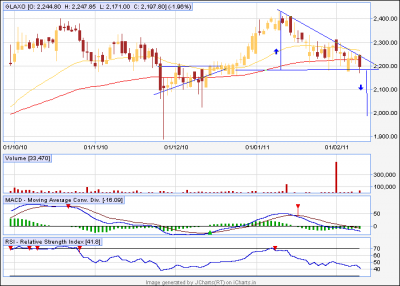
glaxo- i thing stock might be in troble blow 2177. help....
| Description: |
|
| Filesize: |
10.35 KB |
| Viewed: |
718 Time(s) |
|
| Description: |
|
| Filesize: |
11.9 KB |
| Viewed: |
219 Time(s) |
|
|
|
| Back to top |
|
 |
casper
Green Belt

Joined: 02 Oct 2010
Posts: 1315
|
Post: #1804  Posted: Thu Feb 10, 2011 8:37 am Post subject: Posted: Thu Feb 10, 2011 8:37 am Post subject: |
 |
|
glaxo
it has some strong support around 2162-2169, both weekly and monthly s1 are present here, we will have a good move only below this level,watch for a bd with volume, a less volume bd might be a trap also
once broken, it will gradually come down around 2000 level, not only for glaxo, for every pattern, we have to measure the widest part of the pattern and project it from the bo point for up/downward for bo/bd respectively
it ill give us a rough idea of the target, which will be met in due course, but, being a day trader, i can not expect it as a target as i have to finish my trades within 3 pm, so personally, i use monthly/weekly piv or 34/89ema as my target as these levels are good sup/resi level which can not be crossed in intra time frames
colpal
it was some what an AT, but look at the candle i have marked in the chart, it was supposed to be the bo candle, but unfortunately, it opened with a gap up and could not hold it and came down
u may remember that many time i have written in past that during a gap up, going down is likely and during a gap down, a pull back is always expected
so, see here just the same has happened, it went down to bo level as it was the nearest support to hold
but i dont regard this pattern as a perfect one as u can see u have too much spike and dozi candles which shows uncertainty, means traders are not confirmed about what they were going to do, they want to go up, thats why candle are green but the market condition is going against them so they are fearful to be more aggressive
and it does not fit in a few other parameters also, which i will tell u after the market hour as that will need a detail study of AT with candle to candle analysis, so plz be patient

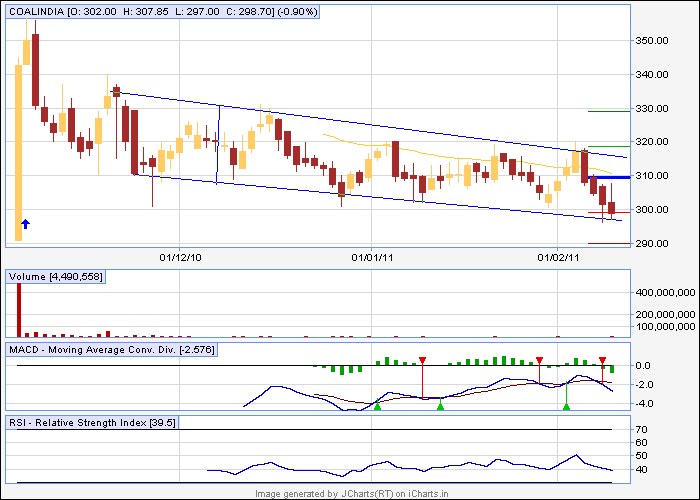
coalindia
if i could attach the channel part with the big green candle, marked with a up-arrow, i wud have considered it as a potential bull flag and wud have predicted a possible break out above 315 level, but we could not attach it, so its not a flag case, we have a channel here
so let us check what we have in our chart now
1. we have weekly support at the lower end of channel
2. we have monthly support at the same stage
3.we have lower tl support too
so breaking below this level wud be tough, but once broken with considerable volume, it will go down at least 23 rupees which is the width of the channel
same goes for an upside bo too, suppose it take support here and goes up and breaks the upper tl, then we will have a 23 rupees target in upside too
always remember that these targets are aprx target, when i say 23 rupees target, i personally wud be ready to book at within 15-20 rupees, just to play it safe
and i have not described rising/falling wedge yet, lack of suitable chart is the problem here as wedge is the most difficult part to identify in t.a
it some what looks like an at or pennant in case of risings one, but gives break down and generally found at the end of a bull market. for falling wedges, it form in a mature bear market to show u a possible upside break out, but it looks like a dt or a pennant some what.
i will describe it in details , but frankly speaking, though i have some exp in finding and trading rising wedge, but i , myself have to study a few charts to find out a falling wedge as wedge does not have a specific shape like other patterns
| Description: |
|
| Filesize: |
10.04 KB |
| Viewed: |
692 Time(s) |
|
| Description: |
|
| Filesize: |
12.38 KB |
| Viewed: |
197 Time(s) |
|
| Description: |
|
| Filesize: |
20.23 KB |
| Viewed: |
185 Time(s) |
|
|
|
| Back to top |
|
 |
ESNMURTY
White Belt

Joined: 31 Oct 2009
Posts: 380
|
Post: #1805  Posted: Thu Feb 10, 2011 9:50 am Post subject: Posted: Thu Feb 10, 2011 9:50 am Post subject: |
 |
|
Dear Sumeshji, what is the stoploss for tatapower shall we hold or exit....................... | sumesh_sol wrote: | | ali522003 wrote: | | sumesh_sol wrote: | | ali522003 wrote: | sumesh bhai ,, reddy falling sharply.. are u holding,, i m still hoding it.. waiting for a upmove,,  |
For a trader, it is extremely important to maintain a sea like calmness while executing his/her trades... Once you take a trade , decide upon Tgt /SL , stick to them...
I have decided for breach of low of BB in 60 tf.. whatever is the value that time , I will exit.... |
ok bhai will follow you.. tatapower also came at 1212.. wat should be the tgt |
I feel initial tgt could be 1240. Once it take it out then may be 1300.. (delivery) |
|
|
| Back to top |
|
 |
sumesh_sol
Brown Belt

Joined: 06 Jun 2010
Posts: 2344
|
Post: #1806  Posted: Thu Feb 10, 2011 10:06 am Post subject: Posted: Thu Feb 10, 2011 10:06 am Post subject: |
 |
|
| ESNMURTY wrote: | Dear Sumeshji, what is the stoploss for tatapower shall we hold or exit....................... | sumesh_sol wrote: | | ali522003 wrote: | | sumesh_sol wrote: | | ali522003 wrote: | sumesh bhai ,, reddy falling sharply.. are u holding,, i m still hoding it.. waiting for a upmove,,  |
For a trader, it is extremely important to maintain a sea like calmness while executing his/her trades... Once you take a trade , decide upon Tgt /SL , stick to them...
I have decided for breach of low of BB in 60 tf.. whatever is the value that time , I will exit.... |
ok bhai will follow you.. tatapower also came at 1212.. wat should be the tgt |
I feel initial tgt could be 1240. Once it take it out then may be 1300.. (delivery) |
|
It is loosing momentum as of now... I would have booked here at some loss, and reentered once it moves above 1250 to be on safer side...
|
|
| Back to top |
|
 |
sumesh_sol
Brown Belt

Joined: 06 Jun 2010
Posts: 2344
|
Post: #1807  Posted: Thu Feb 10, 2011 10:26 am Post subject: CIPLA 15TF Posted: Thu Feb 10, 2011 10:26 am Post subject: CIPLA 15TF |
 |
|
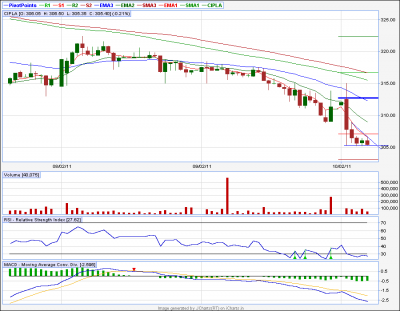
CIPLA 15TF
Below 305 ,, it can reach 302...
| Description: |
|
| Filesize: |
16.63 KB |
| Viewed: |
229 Time(s) |
|
|
|
| Back to top |
|
 |
ESNMURTY
White Belt

Joined: 31 Oct 2009
Posts: 380
|
Post: #1808  Posted: Thu Feb 10, 2011 10:29 am Post subject: Posted: Thu Feb 10, 2011 10:29 am Post subject: |
 |
|
| Sumeshji, I think that a move past 1218 and 1228 should bring back the momentum in the stock
|
|
| Back to top |
|
 |
sumesh_sol
Brown Belt

Joined: 06 Jun 2010
Posts: 2344
|
Post: #1809  Posted: Thu Feb 10, 2011 10:32 am Post subject: Re: CIPLA 15TF Posted: Thu Feb 10, 2011 10:32 am Post subject: Re: CIPLA 15TF |
 |
|
| sumesh_sol wrote: | CIPLA 15TF
Below 305 ,, it can reach 302... |
Covered fully ... 
|
|
| Back to top |
|
 |
sumesh_sol
Brown Belt

Joined: 06 Jun 2010
Posts: 2344
|
Post: #1810  Posted: Thu Feb 10, 2011 10:41 am Post subject: Posted: Thu Feb 10, 2011 10:41 am Post subject: |
 |
|
| ESNMURTY wrote: | | Sumeshji, I think that a move past 1218 and 1228 should bring back the momentum in the stock |
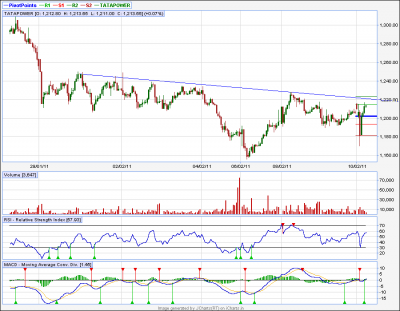
It is facing resistance at sloping line on 15 tf...
one can go long above candle close(15 tf) above this..
I personally will short it at resistance level. and wait for cc if it is above then reverse the position.. (Just my view you can take your decision...)
Always play small qty when not sure..
-Sumesh
| Description: |
|
| Filesize: |
20.47 KB |
| Viewed: |
169 Time(s) |
|
|
|
| Back to top |
|
 |
sumesh_sol
Brown Belt

Joined: 06 Jun 2010
Posts: 2344
|
Post: #1811  Posted: Thu Feb 10, 2011 11:31 am Post subject: Recltd 60tf Posted: Thu Feb 10, 2011 11:31 am Post subject: Recltd 60tf |
 |
|
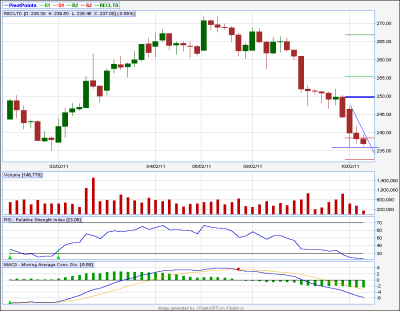
Recltd 60tf
***********
Trading at bottom of last swing..
I will go short below 234.5 . Downside looks very good ,, On EOD it is around 221-225(weekly as well as monthly supports)..
Let's see how it goes...
-Sumesh
| Description: |
|
| Filesize: |
14.66 KB |
| Viewed: |
180 Time(s) |
|
|
|
| Back to top |
|
 |
Ravi_S
Yellow Belt

Joined: 15 Jun 2009
Posts: 569
|
|
| Back to top |
|
 |
anand1234
Yellow Belt

Joined: 17 Jul 2010
Posts: 830
|
Post: #1813  Posted: Thu Feb 10, 2011 11:50 am Post subject: Posted: Thu Feb 10, 2011 11:50 am Post subject: |
 |
|
hi..........sumesh
can I buy dlf @237 - 238 in this range??.......for delivery??........looks good..........if so pls guide me for tgt..........
thanks
anand
|
|
| Back to top |
|
 |
sumesh_sol
Brown Belt

Joined: 06 Jun 2010
Posts: 2344
|
Post: #1814  Posted: Thu Feb 10, 2011 12:34 pm Post subject: Posted: Thu Feb 10, 2011 12:34 pm Post subject: |
 |
|
| sumesh_sol wrote: | | ESNMURTY wrote: | | Sumeshji, I think that a move past 1218 and 1228 should bring back the momentum in the stock |
It is facing resistance at sloping line on 15 tf...
one can go long above candle close(15 tf) above this..
I personally will short it at resistance level. and wait for cc if it is above then reverse the position.. (Just my view you can take your decision...)
Always play small qty when not sure..
-Sumesh |
Shorted at 1221 I covered at 1208.. may be too early..
Also I have removed short order from RECLTD as it moved up .. if it again comes down, may be it will not break with that force...
|
|
| Back to top |
|
 |
sumesh_sol
Brown Belt

Joined: 06 Jun 2010
Posts: 2344
|
Post: #1815  Posted: Thu Feb 10, 2011 12:40 pm Post subject: Posted: Thu Feb 10, 2011 12:40 pm Post subject: |
 |
|
| anand1234 wrote: | hi..........sumesh
can I buy dlf @237 - 238 in this range??.......for delivery??........looks good..........if so pls guide me for tgt..........
thanks
anand |
I can't say about this level.. but above 245 it is likely to have C&H breakout... u can buy above that...
|
|
| Back to top |
|
 |
|
|
You cannot post new topics in this forum
You cannot reply to topics in this forum
You cannot edit your posts in this forum
You cannot delete your posts in this forum
You cannot vote in polls in this forum
You can attach files in this forum
You can download files in this forum
|
Powered by phpBB © 2001, 2005 phpBB Group
|
|
|

