|
|
| View previous topic :: View next topic |
| Author |
a layman's approach to break out and break down |
ESNMURTY
White Belt

Joined: 31 Oct 2009
Posts: 380
|
Post: #1816  Posted: Thu Feb 10, 2011 2:37 pm Post subject: Posted: Thu Feb 10, 2011 2:37 pm Post subject: |
 |
|
| SUMESHJI, DISHTV heading to 62 whether bo happened
|
|
| Back to top |
|
 |
|
|  |
sumesh_sol
Brown Belt

Joined: 06 Jun 2010
Posts: 2344
|
Post: #1817  Posted: Thu Feb 10, 2011 2:50 pm Post subject: Posted: Thu Feb 10, 2011 2:50 pm Post subject: |
 |
|
| ESNMURTY wrote: | | SUMESHJI, DISHTV heading to 62 whether bo happened |
What type of BO u r referring to .. ?? It is neither AT nor DT in any time frame..
There was a very good looking (price wise) AT on 15 tf before sometime, Ali was asking me , I stopped him as RSI and MACD were falt... However, it worked and now moving up...
|
|
| Back to top |
|
 |
ESNMURTY
White Belt

Joined: 31 Oct 2009
Posts: 380
|
Post: #1818  Posted: Thu Feb 10, 2011 2:54 pm Post subject: Posted: Thu Feb 10, 2011 2:54 pm Post subject: |
 |
|
| Entered Dish at 58.80 and sold at 59.90
|
|
| Back to top |
|
 |
ali522003
White Belt

Joined: 03 Jul 2010
Posts: 217
|
Post: #1819  Posted: Thu Feb 10, 2011 2:55 pm Post subject: Posted: Thu Feb 10, 2011 2:55 pm Post subject: |
 |
|
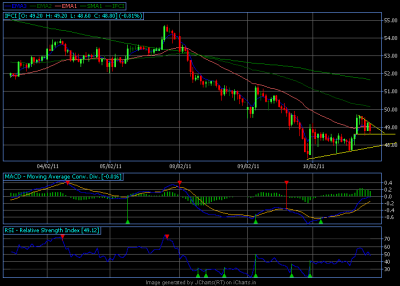
ifci below 48.60 can fall upto 48.
comments invited.
| Description: |
|
| Filesize: |
15.36 KB |
| Viewed: |
234 Time(s) |
|
Last edited by ali522003 on Thu Feb 10, 2011 3:01 pm; edited 1 time in total |
|
| Back to top |
|
 |
ali522003
White Belt

Joined: 03 Jul 2010
Posts: 217
|
Post: #1820  Posted: Thu Feb 10, 2011 2:57 pm Post subject: Posted: Thu Feb 10, 2011 2:57 pm Post subject: |
 |
|
| ESNMURTY wrote: | | Entered Dish at 58.80 and sold at 59.90 |
dear, same was my level.. but didnt trade as sumesh bhai stopped.. but i agree that it was a vey risky trade. 
|
|
| Back to top |
|
 |
sumesh_sol
Brown Belt

Joined: 06 Jun 2010
Posts: 2344
|
Post: #1821  Posted: Thu Feb 10, 2011 3:01 pm Post subject: Posted: Thu Feb 10, 2011 3:01 pm Post subject: |
 |
|
| ali522003 wrote: | | ESNMURTY wrote: | | Entered Dish at 58.80 and sold at 59.90 |
dear, same was my level.. but didnt trade as sumesh bhai stopped.. but i agree that it was a vey risky trade.  |
I will not say it was risky or something, but as it was not meeting our precondition of entering trades , so I avoided (despite of temptation) and asked Ali to use his discretion... There are times u miss on such beautiful rallies but many times they save your skin by false BOs... So far I believe so !!!!!
|
|
| Back to top |
|
 |
ali522003
White Belt

Joined: 03 Jul 2010
Posts: 217
|
Post: #1822  Posted: Thu Feb 10, 2011 3:03 pm Post subject: Posted: Thu Feb 10, 2011 3:03 pm Post subject: |
 |
|
| ali522003 wrote: | ifci below 48.60 can fall upto 47.8.
comments invited. |
|
|
| Back to top |
|
 |
casper
Green Belt

Joined: 02 Oct 2010
Posts: 1315
|
Post: #1823  Posted: Thu Feb 10, 2011 9:02 pm Post subject: Posted: Thu Feb 10, 2011 9:02 pm Post subject: |
 |
|
| casper wrote: |
but i dont regard this pattern as a perfect one as u can see u have too much spike and dozi candles which shows uncertainty, means traders are not confirmed about what they were going to do, they want to go up, thats why candle are green but the market condition is going against them so they are fearful to be more aggressive
and it does not fit in a few other parameters also, which i will tell u after the market hour as that will need a detail study of AT with candle to candle analysis, so plz be patient

|
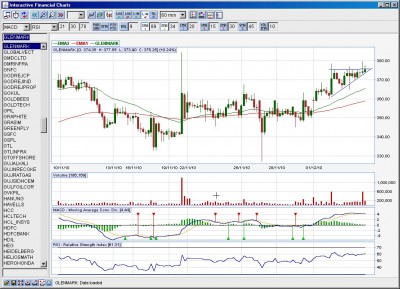
hii techocall
in morning i told u that i will write in details about the description of an A.T . so now i am putting my version of ascending triangle here
while both u and me have seen and will see hell lot of AT, but before setting an example by attaching a chart, (which i already did for at least a hundred times) i am giving u an account of what happens when an ascending triangle forms
the psychology behind forming an A.T
let us discuss the idea of resistance, bcoz the idea of resi is going to play the most crucial part in the analysis
what is a resistance any way?
its a zone where sellers out numbers the buyers, means at this place, more and more selling is likely which will take down the price and send the price back from where it came
in my crazy words, its a zone where u, me or some big buddies get itchy fingers due to whatsoever reasons such as, presence of pivots, cam , fib levels, presence of important and widely accepted emas, or may be due to some psychological fear factor, and sell out their holding to book profit
plz keep it in mind the resi is a zone where more selling than buying is likely, and as more peoples will sell, so the less number of buyers will force them to sell even in lower price, as simply here supply will be more greater than the demand
by da way, now u can conclude, the "support" is just opposite to this resi,where buyer will outnumber the sellers
ok, let us jump to an A.T
what is happening here?
we have two trendlines
1. the horizontal trend line and
2.inclined trend line
we get the horizontal line by connecting the tops and we get the inclined one by connecting the lows, alright?
now plz check the chart im posting, its an old chart, nowadays, finding A.T is becoming like next to impossible, just use it for ur reference
1st, the inclined line. it is supporting the pattern, its formed by connecting a series of lows, which shows buyers are ready to buy and practically buying along with this level
this line in slopping up, showing that buyers are ready to buy at even higher prices thats why, every low is higher than the previous one, means as the time goes on, buyers are buying like hell
clear????
now let us come to the horizontal line, its formed by connecting all the highs, which shows the resistance, means, some big boy or even the sellers are ready to sell at a fixed price only, here by sell, i mean huge selling
thats why whenever price is rising to that big sell order, its facing resi, and going down then buyers are buying more so its going up to the resi level once again , only to go down after facing resi
clear?
so this is our good old ascending triangle psychology
now whats happening during a break out???
the huge sell order, which was resi and was responsible for choking the possible upmove of the price, is after some time, getting neutralized,
simply bcoz, every time price is hitting that level, a portion of that order is getting executed, and eventually, this sell order at one time or another, will be satisfied naa?
thats happening here
after a number of hits, when its getting totally neutralized but at the same time, the demand is increasing and buyers are ready to pay even higher price, the break out with a volume is happening
so this the reason and mode of operation of an A.T
now, u dont need to compare charts to know if it is an A.T or not,
whenever u see an A.T like pattern, just try to find the above mentioned psychological aspects, if u find these aspects then ur a.t will rock
by da way
i tried to write in in a casual way intentionally, so that i could narrate u what is happening here, plz dont forget to give me a feed back if it helped u to understood the thing or not
| Description: |
|
| Filesize: |
191.57 KB |
| Viewed: |
253 Time(s) |
|
|
|
| Back to top |
|
 |
technocalls
White Belt

Joined: 27 Aug 2010
Posts: 34
|
|
| Back to top |
|
 |
casper
Green Belt

Joined: 02 Oct 2010
Posts: 1315
|
Post: #1825  Posted: Thu Feb 10, 2011 10:36 pm Post subject: Posted: Thu Feb 10, 2011 10:36 pm Post subject: |
 |
|
hi technocalls,
thanks and welcome
yes dlf looks like a true a.t
just be a lil careful around 34 ema in eod
|
|
| Back to top |
|
 |
ESNMURTY
White Belt

Joined: 31 Oct 2009
Posts: 380
|
Post: #1826  Posted: Thu Feb 10, 2011 10:45 pm Post subject: Posted: Thu Feb 10, 2011 10:45 pm Post subject: |
 |
|
SUPERB.. explained in such a way that even a layman like me can understand ....Thanks to you Casper.. | casper wrote: | | casper wrote: |
but i dont regard this pattern as a perfect one as u can see u have too much spike and dozi candles which shows uncertainty, means traders are not confirmed about what they were going to do, they want to go up, thats why candle are green but the market condition is going against them so they are fearful to be more aggressive
and it does not fit in a few other parameters also, which i will tell u after the market hour as that will need a detail study of AT with candle to candle analysis, so plz be patient

|
hii techocall
in morning i told u that i will write in details about the description of an A.T . so now i am putting my version of ascending triangle here
while both u and me have seen and will see hell lot of AT, but before setting an example by attaching a chart, (which i already did for at least a hundred times) i am giving u an account of what happens when an ascending triangle forms
the psychology behind forming an A.T
let us discuss the idea of resistance, bcoz the idea of resi is going to play the most crucial part in the analysis
what is a resistance any way?
its a zone where sellers out numbers the buyers, means at this place, more and more selling is likely which will take down the price and send the price back from where it came
in my crazy words, its a zone where u, me or some big buddies get itchy fingers due to whatsoever reasons such as, presence of pivots, cam , fib levels, presence of important and widely accepted emas, or may be due to some psychological fear factor, and sell out their holding to book profit
plz keep it in mind the resi is a zone where more selling than buying is likely, and as more peoples will sell, so the less number of buyers will force them to sell even in lower price, as simply here supply will be more greater than the demand
by da way, now u can conclude, the "support" is just opposite to this resi,where buyer will outnumber the sellers
ok, let us jump to an A.T
what is happening here?
we have two trendlines
1. the horizontal trend line and
2.inclined trend line
we get the horizontal line by connecting the tops and we get the inclined one by connecting the lows, alright?
now plz check the chart im posting, its an old chart, nowadays, finding A.T is becoming like next to impossible, just use it for ur reference
1st, the inclined line. it is supporting the pattern, its formed by connecting a series of lows, which shows buyers are ready to buy and practically buying along with this level
this line in slopping up, showing that buyers are ready to buy at even higher prices thats why, every low is higher than the previous one, means as the time goes on, buyers are buying like hell
clear????
now let us come to the horizontal line, its formed by connecting all the highs, which shows the resistance, means, some big boy or even the sellers are ready to sell at a fixed price only, here by sell, i mean huge selling
thats why whenever price is rising to that big sell order, its facing resi, and going down then buyers are buying more so its going up to the resi level once again , only to go down after facing resi
clear?
so this is our good old ascending triangle psychology
now whats happening during a break out???
the huge sell order, which was resi and was responsible for choking the possible upmove of the price, is after some time, getting neutralized,
simply bcoz, every time price is hitting that level, a portion of that order is getting executed, and eventually, this sell order at one time or another, will be satisfied naa?
thats happening here
after a number of hits, when its getting totally neutralized but at the same time, the demand is increasing and buyers are ready to pay even higher price, the break out with a volume is happening
so this the reason and mode of operation of an A.T
now, u dont need to compare charts to know if it is an A.T or not,
whenever u see an A.T like pattern, just try to find the above mentioned psychological aspects, if u find these aspects then ur a.t will rock
by da way
i tried to write in in a casual way intentionally, so that i could narrate u what is happening here, plz dont forget to give me a feed back if it helped u to understood the thing or not |
|
|
| Back to top |
|
 |
abhideep
White Belt

Joined: 17 Jan 2010
Posts: 46
|
Post: #1827  Posted: Thu Feb 10, 2011 11:34 pm Post subject: update on PETROLNG Posted: Thu Feb 10, 2011 11:34 pm Post subject: update on PETROLNG |
 |
|
hi casper
if you could pls update tgts on PETROLNG
its broken 122 today!!... closed well below!
Abhideep
|
|
| Back to top |
|
 |
rohit44
White Belt

Joined: 05 Jan 2010
Posts: 279
|
Post: #1828  Posted: Thu Feb 10, 2011 11:42 pm Post subject: Posted: Thu Feb 10, 2011 11:42 pm Post subject: |
 |
|
| hindalco looking weak....can seniors plz advise the right time to enter puts.....with sl and tgt???....rgds
|
|
| Back to top |
|
 |
ali522003
White Belt

Joined: 03 Jul 2010
Posts: 217
|
Post: #1829  Posted: Thu Feb 10, 2011 11:59 pm Post subject: Posted: Thu Feb 10, 2011 11:59 pm Post subject: |
 |
|
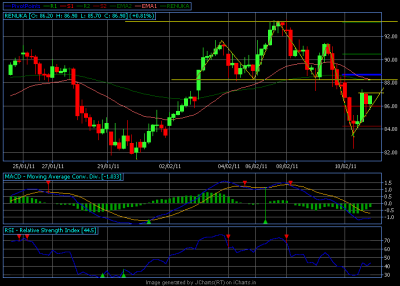
renuka- just check the renuka ,,, after making head & shoulder in 60tf it fell approx 4rs
now making AT on 87.10 so according to me its a buy abv that. tgt 2.5rs
experts please comment on this.
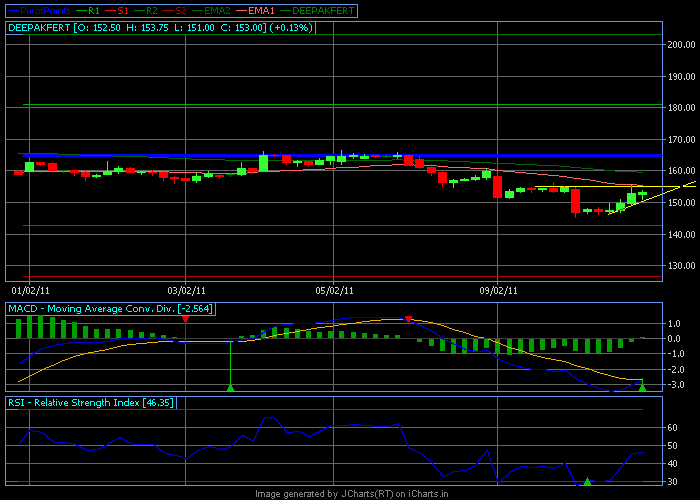
deepakfert- Though i m not very sure in this at but yes feels like a good trade.. need guidance in this.
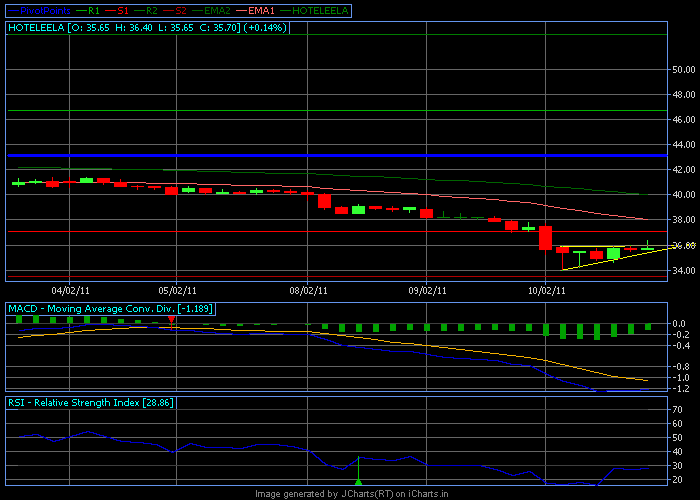
hoteleela- looks like AT should BO abv 35.95
| Description: |
|
| Filesize: |
9.52 KB |
| Viewed: |
849 Time(s) |
|
| Description: |
|
| Filesize: |
10.19 KB |
| Viewed: |
855 Time(s) |
|
| Description: |
|
| Filesize: |
15.44 KB |
| Viewed: |
157 Time(s) |
|
|
|
| Back to top |
|
 |
singh.ravee
Yellow Belt

Joined: 12 Aug 2010
Posts: 678
|
Post: #1830  Posted: Fri Feb 11, 2011 8:48 am Post subject: Posted: Fri Feb 11, 2011 8:48 am Post subject: |
 |
|
| technocalls wrote: | thankx casper....thanx a lot ..fist of all i like to salute u  i cont find any salute emoticons so two thumbs up ...now a days lots of people putting lots of charts and queries in ur forum n u answer most of theme ....... commitment level is very good "ek baar jo maine commite kar diya to main apne aap ki bhi nahi sunta" i cont find any salute emoticons so two thumbs up ...now a days lots of people putting lots of charts and queries in ur forum n u answer most of theme ....... commitment level is very good "ek baar jo maine commite kar diya to main apne aap ki bhi nahi sunta"  .....i am getting your point i want to attch a chart here dlf is it a AT ???? i thin i sure this time its AT..now let me go further buy DLF abw 246.9 target 267??m i right???? i thing its also a break out of trendline also plz reply... .....i am getting your point i want to attch a chart here dlf is it a AT ???? i thin i sure this time its AT..now let me go further buy DLF abw 246.9 target 267??m i right???? i thing its also a break out of trendline also plz reply... |
Technocalls,
one word of caution in dlf at. the volume is unusually high. I have a doubt on upward breakout.
May be caper can throw more light on it.
thanks and regards
ravee
|
|
| Back to top |
|
 |
|
|
You cannot post new topics in this forum
You cannot reply to topics in this forum
You cannot edit your posts in this forum
You cannot delete your posts in this forum
You cannot vote in polls in this forum
You can attach files in this forum
You can download files in this forum
|
Powered by phpBB © 2001, 2005 phpBB Group
|
|
|

