|
|
| View previous topic :: View next topic |
| Author |
a layman's approach to break out and break down |
singh.ravee
Yellow Belt

Joined: 12 Aug 2010
Posts: 678
|
Post: #1861  Posted: Fri Feb 11, 2011 5:58 pm Post subject: Posted: Fri Feb 11, 2011 5:58 pm Post subject: |
 |
|
casper bhai,
u r a wonderful analyst. only thing is u need to apply more aptly what u have learned to become a more successful trader. Remember i m using word "more".
I am sharing my views with no offence intended to anyone. As I was not trading, I got chance to read the new book that was recommended in the thread. As usual, like many other books written on the subject, I find it contains randomly random stories on trading.
Think if any of these book exist
1. Come into my trading room - personal invitation for 1day - by casper
2. Come into my room trading room - personal invitation for 1day - by veerrapan/ jimmie/ sherbaaz/ chrome/ speculator/ ravi/ other experts about whom i dont know/ nsinojina(for hilarious jokes that he cracks in sb; no doubt he is a good trader)
You should think of picking up atleast one future stock to enjoy the short side.
Thanks and Regards
Ravee
|
|
| Back to top |
|
 |
|
|  |
singh.ravee
Yellow Belt

Joined: 12 Aug 2010
Posts: 678
|
Post: #1862  Posted: Fri Feb 11, 2011 6:02 pm Post subject: Posted: Fri Feb 11, 2011 6:02 pm Post subject: |
 |
|
Casper,
found this on swing points in google search.
Take any candle and think of that candle as the start candle (S). If there are two consecutive higher highs than the candle you marked (S) then that is a swing up and vice versa for swing down
dont know the validity of this method
regards
ravee
|
|
| Back to top |
|
 |
ESNMURTY
White Belt

Joined: 31 Oct 2009
Posts: 380
|
Post: #1863  Posted: Fri Feb 11, 2011 6:04 pm Post subject: Posted: Fri Feb 11, 2011 6:04 pm Post subject: |
 |
|
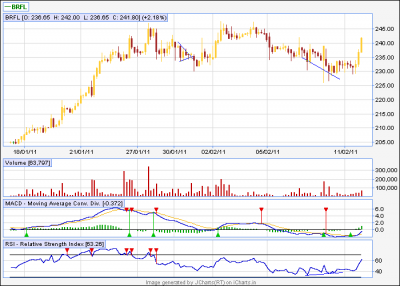
Thank you Casper... Kindly highlight the key points to be borne in mind in case of a falling TL BO as in this case. | sumesh_sol wrote: | | casper wrote: | | ESNMURTY wrote: | | Dear Seniors, Kindly clarify, BRFL 60TF DT is breaking out on the upside... how can it be understood.... |
was not on my desk, sorry for late reply
during a pattern formation, plz check the rsi and macd, though i hv not checked the chart yet, but it seems to me that rsi was bullish at the time of pull back
i will go through the chart once i get some free times and will update u, in the mean time, u can check and feed back me too
 |
BRFL took some support and then broke falling TL , that is what was the reason of BO. Had there was no base formation then a TL break would not be that much helpful.. |
|
|
| Back to top |
|
 |
casper
Green Belt

Joined: 02 Oct 2010
Posts: 1315
|
Post: #1864  Posted: Fri Feb 11, 2011 7:48 pm Post subject: Posted: Fri Feb 11, 2011 7:48 pm Post subject: |
 |
|
hi esnmurty
apart from sumesh bhai's mentioned point of forming base, see what happened during the pattern formation
plz concentrate on the marked spot in the chart
price was making lower low, but rsi was making higher low, which is positive divergence,
u know rsi is a momentum indicator, when the price was going down, we concluded that price will go down even more due to bearish momentum and finally will result in break down,
but check the corresponding rsi, rsi was making higher low, which was in the contrary to the price movements and which was an indication that bears are losing ground and bulls are gaining power
now, the divergence, itself a vast discipline of trading, and wonderful trades can be taken depending on divergence only, but like many good thing, it needs some practice to master the art 
our ravi bhaiyya (or ravi anna???  ) started a thread on that topic where he along with sherbaaz bhai, made nice attempt to explain the things to even a fresher and traded them nicely too, i would recommend u to take a look and understand the divergence case from this thread, then the relation between rsi and price will become much clearer to u, im giving the link below ) started a thread on that topic where he along with sherbaaz bhai, made nice attempt to explain the things to even a fresher and traded them nicely too, i would recommend u to take a look and understand the divergence case from this thread, then the relation between rsi and price will become much clearer to u, im giving the link below
http://www.icharts.in/forum/trading-divergences-t2170.html
(if u r using rsi 21/30/70 setting, which is default setting of jcharts, plz change it to rsi 14/30/70 for a clear view and more swift signal)
go through the thread and then if u hv any doubts u r always welcome
| Description: |
|
| Filesize: |
12.81 KB |
| Viewed: |
226 Time(s) |
|
|
|
| Back to top |
|
 |
casper
Green Belt

Joined: 02 Oct 2010
Posts: 1315
|
Post: #1865  Posted: Fri Feb 11, 2011 7:59 pm Post subject: Posted: Fri Feb 11, 2011 7:59 pm Post subject: |
 |
|
| singh.ravee wrote: | casper bhai,
u r a wonderful analyst. only thing is u need to apply more aptly what u have learned to become a more successful trader. Remember i m using word "more".
I am sharing my views with no offence intended to anyone. As I was not trading, I got chance to read the new book that was recommended in the thread. As usual, like many other books written on the subject, I find it contains randomly random stories on trading.
Think if any of these book exist
1. Come into my trading room - personal invitation for 1day - by casper
2. Come into my room trading room - personal invitation for 1day - by veerrapan/ jimmie/ sherbaaz/ chrome/ speculator/ ravi/ other experts about whom i dont know/ nsinojina(for hilarious jokes that he cracks in sb; no doubt he is a good trader)
You should think of picking up atleast one future stock to enjoy the short side.
Thanks and Regards
Ravee |
hi raveee
thanks for ur kind words, u know for trading and t.a. study, such inspirations plays a great role to me, just like all of us, me too go through bad phases but believe me, its the trust and love of all of u which brings me back in the right path
  
and as far as book is concern, my 2nd year in this market is going on, just wait only for 18 more years, then i will surely write it down

|
|
| Back to top |
|
 |
rohit44
White Belt

Joined: 05 Jan 2010
Posts: 279
|
Post: #1866  Posted: Fri Feb 11, 2011 8:53 pm Post subject: Posted: Fri Feb 11, 2011 8:53 pm Post subject: |
 |
|
| Thank you casper brother....thks a ton for your view....what an exact analysis...hindalco after breaking 214 stopped at 200 and reversed...superb...now sir what is the next move as it closed below monthly s1 214....even in reversal it was not able to cross 211 convincingly.....tomorrow is the result day also...please guide....i am a non techie...just trade with the help of screen reading...but all of you seniors analysis also help me out to learn more and to be more confident...Rgds
|
|
| Back to top |
|
 |
ESNMURTY
White Belt

Joined: 31 Oct 2009
Posts: 380
|
Post: #1867  Posted: Fri Feb 11, 2011 11:19 pm Post subject: Posted: Fri Feb 11, 2011 11:19 pm Post subject: |
 |
|
Thank you both for the guidance. I had noticed a BO in DT 60tf of BRFL supported by good volume with RSI rising as also the MACD and got into the trde with233 as stoploss. | casper wrote: | hi esnmurty
apart from sumesh bhai's mentioned point of forming base, see what happened during the pattern formation
plz concentrate on the marked spot in the chart
price was making lower low, but rsi was making higher low, which is positive divergence,
u know rsi is a momentum indicator, when the price was going down, we concluded that price will go down even more due to bearish momentum and finally will result in break down,
but check the corresponding rsi, rsi was making higher low, which was in the contrary to the price movements and which was an indication that bears are losing ground and bulls are gaining power
now, the divergence, itself a vast discipline of trading, and wonderful trades can be taken depending on divergence only, but like many good thing, it needs some practice to master the art 
our ravi bhaiyya (or ravi anna???  ) started a thread on that topic where he along with sherbaaz bhai, made nice attempt to explain the things to even a fresher and traded them nicely too, i would recommend u to take a look and understand the divergence case from this thread, then the relation between rsi and price will become much clearer to u, im giving the link below ) started a thread on that topic where he along with sherbaaz bhai, made nice attempt to explain the things to even a fresher and traded them nicely too, i would recommend u to take a look and understand the divergence case from this thread, then the relation between rsi and price will become much clearer to u, im giving the link below
http://www.icharts.in/forum/trading-divergences-t2170.html
(if u r using rsi 21/30/70 setting, which is default setting of jcharts, plz change it to rsi 14/30/70 for a clear view and more swift signal)
go through the thread and then if u hv any doubts u r always welcome |
|
|
| Back to top |
|
 |
girishhu1
White Belt

Joined: 17 Aug 2009
Posts: 316
|
Post: #1868  Posted: Sat Feb 12, 2011 9:29 am Post subject: Posted: Sat Feb 12, 2011 9:29 am Post subject: |
 |
|
HI CASPERJI,
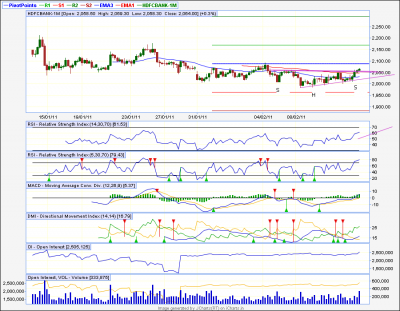
enclosing 60 m chart of hdfc bank ,wherein i see an at formation as well as hns pattern.
rsi rising
macd in buy mode
price has crossed 89 ema but below monthly pivot.
vol ok
entry above 2064 sl 2054 target about rs.90
earlier trend down but now appears in pullback mode.
pl confirm if anything i am overlooking.
regards,
girish
| Description: |
|
| Filesize: |
71.4 KB |
| Viewed: |
205 Time(s) |
|
|
|
| Back to top |
|
 |
singh.ravee
Yellow Belt

Joined: 12 Aug 2010
Posts: 678
|
Post: #1869  Posted: Sat Feb 12, 2011 11:54 am Post subject: Posted: Sat Feb 12, 2011 11:54 am Post subject: |
 |
|
Casper Hello,
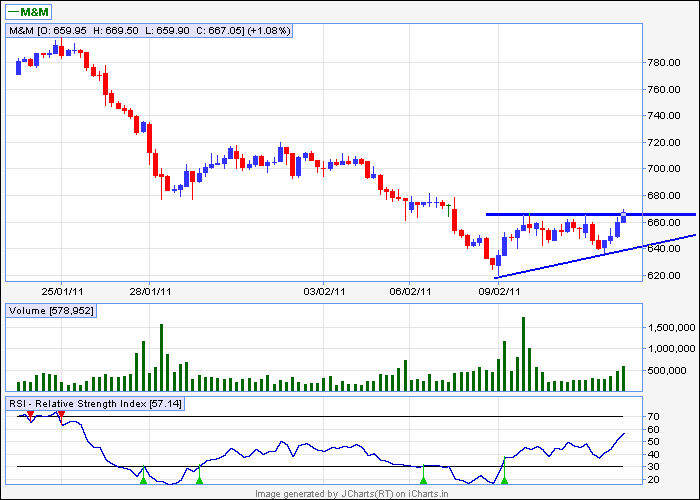
Is it an A.T. in m&m 60min.
thanks and regards
ravee
| Description: |
|
| Filesize: |
10.37 KB |
| Viewed: |
747 Time(s) |
|
|
|
| Back to top |
|
 |
singh.ravee
Yellow Belt

Joined: 12 Aug 2010
Posts: 678
|
Post: #1870  Posted: Sat Feb 12, 2011 12:07 pm Post subject: Posted: Sat Feb 12, 2011 12:07 pm Post subject: |
 |
|
Casper,
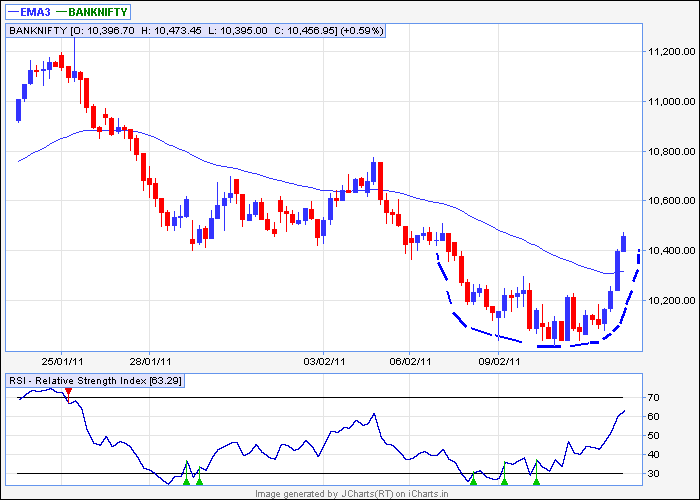
Is it a rounding bottom in bank nifty 60min?
If yes, how to trade it and what could be tgt and sl.
thanks and regards
ravee
| Description: |
|
| Filesize: |
11.23 KB |
| Viewed: |
719 Time(s) |
|
|
|
| Back to top |
|
 |
casper
Green Belt

Joined: 02 Oct 2010
Posts: 1315
|
Post: #1871  Posted: Sat Feb 12, 2011 8:05 pm Post subject: Posted: Sat Feb 12, 2011 8:05 pm Post subject: |
 |
|
| girishhu1 wrote: | HI CASPERJI,
enclosing 60 m chart of hdfc bank ,wherein i see an at formation as well as hns pattern.
rsi rising
macd in buy mode
price has crossed 89 ema but below monthly pivot.
vol ok
entry above 2064 sl 2054 target about rs.90
earlier trend down but now appears in pullback mode.
pl confirm if anything i am overlooking.
regards,
girish |
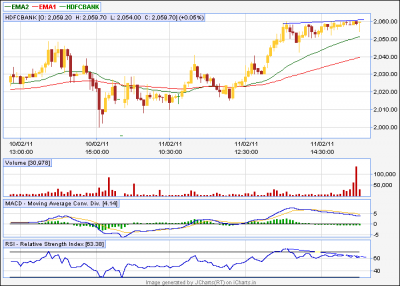
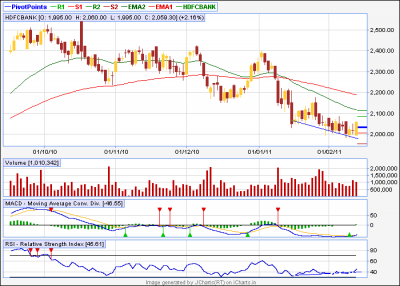
every thing is alright, just i am mentioning a word of caution!!!
i see some negative divergence in 5 min chart, so i am expecting either a gap down opening or a going down, then find support and the going up heavily
ps: bullish divergence is seen in eod, which will work late but work heavily i believe, jc 17 is 5 min chart and jc 18 is eod chart
| Description: |
|
| Filesize: |
12.12 KB |
| Viewed: |
175 Time(s) |
|
| Description: |
|
| Filesize: |
13.3 KB |
| Viewed: |
175 Time(s) |
|
|
|
| Back to top |
|
 |
casper
Green Belt

Joined: 02 Oct 2010
Posts: 1315
|
Post: #1872  Posted: Sat Feb 12, 2011 8:10 pm Post subject: Posted: Sat Feb 12, 2011 8:10 pm Post subject: |
 |
|
| singh.ravee wrote: | Casper Hello,
Is it an A.T. in m&m 60min.
thanks and regards
ravee |
hii ravee, yes, its an A.T
i will target 89 ema in 60 min chart at 685 and 691 as possible targets here
|
|
| Back to top |
|
 |
singh.ravee
Yellow Belt

Joined: 12 Aug 2010
Posts: 678
|
Post: #1873  Posted: Sat Feb 12, 2011 8:15 pm Post subject: Posted: Sat Feb 12, 2011 8:15 pm Post subject: |
 |
|
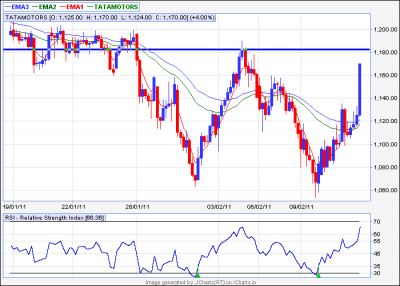
Casper,
Is it a BIG double bottom in tatamotors 60min.
regards
ravee
p.s.: its still under formation. need to keep an eye on it.
| Description: |
|
| Filesize: |
14 KB |
| Viewed: |
190 Time(s) |
|
|
|
| Back to top |
|
 |
casper
Green Belt

Joined: 02 Oct 2010
Posts: 1315
|
Post: #1874  Posted: Sat Feb 12, 2011 8:22 pm Post subject: Posted: Sat Feb 12, 2011 8:22 pm Post subject: |
 |
|
| singh.ravee wrote: | Casper,
Is it a rounding bottom in bank nifty 60min?
If yes, how to trade it and what could be tgt and sl.
thanks and regards
ravee |
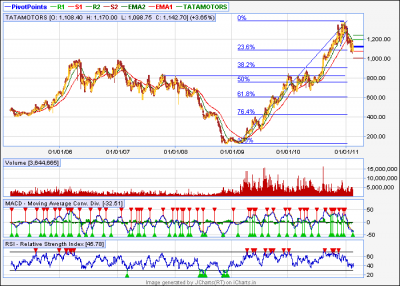
it looks like a rounding bottom and such pattern works in real time charts too, but in classical theory, a rounding bottom takes months , in some cases years to form, and this patterns psychology is- after a massive fall, a group of informed investors are accumulating the stock at lower level when the general public is in darkness about the future of the stock
as, in real time, such charts form over a much smaller time, so i generally dont try to trade them as i think the target projection in classical way may not be applicable in these cases and i might get trapped
but this is definitely a sign of bottoming out
ps- if u want to see the potential target of a true rounding bottom, plz check the tatamotors chart i am attaching
its one the tragedies of my life, that in spite of spotting it successfully in late 2009, i could not afford to buy it as i was going through a severe "economical depressions"
  
| Description: |
|
| Filesize: |
22.36 KB |
| Viewed: |
246 Time(s) |
|
|
|
| Back to top |
|
 |
singh.ravee
Yellow Belt

Joined: 12 Aug 2010
Posts: 678
|
Post: #1875  Posted: Sat Feb 12, 2011 8:26 pm Post subject: Posted: Sat Feb 12, 2011 8:26 pm Post subject: |
 |
|
casper bhai,
waqt kabhie bhi ek jaisa nahi rehta. I wish u even bigger success in times to come. 
regards
ravee
|
|
| Back to top |
|
 |
|
|
You cannot post new topics in this forum
You cannot reply to topics in this forum
You cannot edit your posts in this forum
You cannot delete your posts in this forum
You cannot vote in polls in this forum
You can attach files in this forum
You can download files in this forum
|
Powered by phpBB © 2001, 2005 phpBB Group
|
|
|

