| View previous topic :: View next topic |
| Author |
a layman's approach to break out and break down |
casper
Green Belt

Joined: 02 Oct 2010
Posts: 1315
|
Post: #1876  Posted: Sat Feb 12, 2011 8:26 pm Post subject: Posted: Sat Feb 12, 2011 8:26 pm Post subject: |
 |
|
| singh.ravee wrote: | Casper,
Is it a BIG double bottom in tatamotors 60min.
regards
ravee
p.s.: its still under formation. need to keep an eye on it. |
yes its a potential double bottom
but dont hop in it with the bo, monthly piv is too near to bo level, so plz check its reaction at monthly pivot too
|
|
| Back to top |
|
 |
|
|
 |
casper
Green Belt

Joined: 02 Oct 2010
Posts: 1315
|
Post: #1877  Posted: Sat Feb 12, 2011 8:30 pm Post subject: Posted: Sat Feb 12, 2011 8:30 pm Post subject: |
 |
|
| singh.ravee wrote: | casper bhai,
waqt kabhie bhi ek jaisa nahi rehta. I wish u even bigger success in times to come. 
regards
ravee |
thank u brother, yes,
'Oh, deep in my heart
I do believe
We shall overcome some day"
  
|
|
| Back to top |
|
 |
casper
Green Belt

Joined: 02 Oct 2010
Posts: 1315
|
Post: #1878  Posted: Sat Feb 12, 2011 10:50 pm Post subject: Posted: Sat Feb 12, 2011 10:50 pm Post subject: |
 |
|
hey sumesh bhai
i found dr elder in face book too
just updating so that u may find him and add him if possible
(st sir/pt sir i hope this wont be regarded as a violation)
|
|
| Back to top |
|
 |
singh.ravee
Yellow Belt

Joined: 12 Aug 2010
Posts: 678
|
Post: #1879  Posted: Sun Feb 13, 2011 9:01 am Post subject: Posted: Sun Feb 13, 2011 9:01 am Post subject: |
 |
|
Casper bhai,
My full name is Ravinder Singh and I reside in Ludhiana, Punjab.
May I know your full name.
Thanks and Regards
ravee
|
|
| Back to top |
|
 |
casper
Green Belt

Joined: 02 Oct 2010
Posts: 1315
|
Post: #1880  Posted: Sun Feb 13, 2011 9:07 am Post subject: Posted: Sun Feb 13, 2011 9:07 am Post subject: |
 |
|
| singh.ravee wrote: | Casper bhai,
My full name is Ravinder Singh and I reside in Ludhiana, Punjab.
May I know your full name.
Thanks and Regards
ravee |
tushar chatterjee, dumdum, kolkata

|
|
| Back to top |
|
 |
casper
Green Belt

Joined: 02 Oct 2010
Posts: 1315
|
Post: #1881  Posted: Sun Feb 13, 2011 9:40 pm Post subject: Posted: Sun Feb 13, 2011 9:40 pm Post subject: |
 |
|
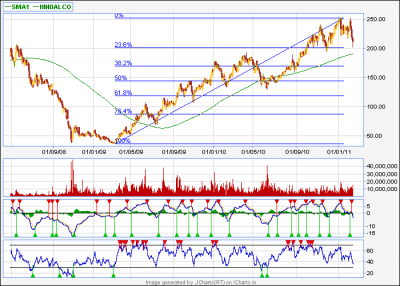
| rohit44 wrote: | | Thank you casper brother....thks a ton for your view....what an exact analysis...hindalco after breaking 214 stopped at 200 and reversed...superb...now sir what is the next move as it closed below monthly s1 214....even in reversal it was not able to cross 211 convincingly.....tomorrow is the result day also...please guide....i am a non techie...just trade with the help of screen reading...but all of you seniors analysis also help me out to learn more and to be more confident...Rgds |
expect good up move above 214-217 range only as both weekly and monthly level is present here and 215 is also the fib 50% level of previous downmove from 250
so technically we need to clear this zone for any fresh up move in intra or short term
while the results are out, some says its below par and some say its alright, and i really dont understand fundamental analysis so i would better keep way from the counter as i generally do on any fundamental news release date, but given the recent rally in copper, it definitely worths buying for mid to long term
for a mid to long term pick i would like to buy it around 200 level and would keep a sl below 190 which is the 200 sma , one of the most important level
plz see the attached chart, it will show u the importance of 200 level (as an important fib level in eod) and the position of 200sma
ps: sorry for late reply, just saw ur post now
| Description: |
|
| Filesize: |
20.25 KB |
| Viewed: |
211 Time(s) |

|
|
|
| Back to top |
|
 |
rohit44
White Belt

Joined: 05 Jan 2010
Posts: 279
|
Post: #1882  Posted: Sun Feb 13, 2011 11:39 pm Post subject: Posted: Sun Feb 13, 2011 11:39 pm Post subject: |
 |
|
| Thank you brother......Thanks for your detailed reply....it gives me immense confident, thought and direction to trade now...i love to be on shorter side of this but these analysis can help me out to save me from losses.....thanks again........(ps: sorry for late reply, just saw ur post now).....why sorry bro???? this statement show how down to earth man you are....you are doing your best for beginners which involves lots of hard work, many sleepless nights, efforts without any self...then why sorry....don't said this again plz it not suits you and its not delayed still mkt to open on monday.....hats offf to your efforts which helps here lot of people...keep up the good job done....RGDS AND THKS
|
|
| Back to top |
|
 |
casper
Green Belt

Joined: 02 Oct 2010
Posts: 1315
|
Post: #1883  Posted: Mon Feb 14, 2011 8:46 am Post subject: Posted: Mon Feb 14, 2011 8:46 am Post subject: |
 |
|
| rohit44 wrote: | | Thank you brother......Thanks for your detailed reply....it gives me immense confident, thought and direction to trade now...i love to be on shorter side of this but these analysis can help me out to save me from losses.....thanks again........(ps: sorry for late reply, just saw ur post now).....why sorry bro???? this statement show how down to earth man you are....you are doing your best for beginners which involves lots of hard work, many sleepless nights, efforts without any self...then why sorry....don't said this again plz it not suits you and its not delayed still mkt to open on monday.....hats offf to your efforts which helps here lot of people...keep up the good job done....RGDS AND THKS |
just one thing to mention, its a general thumb rule
1. in case of gap up, it is generally followed by a fall to cover the gap, so wait and watch and short the asset as soon as it hits the resi and starts going down,
only during strong bull run, u will see gap up and going up, just like september to mid november 2010, other wise it will go down on 90% occasion
2.same, if u see a gap down, u will see soon it will make its base and will start going up
only during during strong bear phase like "euro crisis in Greece" i have seen such phenomenon, that it opened with a gap down and then went down, but that too, only for 1-2 days
so if it opens in a gap down manner, just forget shorting, watch it until it reaches some support zone , then buy for a up move
but remember, this is strictly an intra trading rule
|
|
| Back to top |
|
 |
singh.ravee
Yellow Belt

Joined: 12 Aug 2010
Posts: 678
|
Post: #1884  Posted: Mon Feb 14, 2011 10:32 am Post subject: Posted: Mon Feb 14, 2011 10:32 am Post subject: |
 |
|
casper hello,
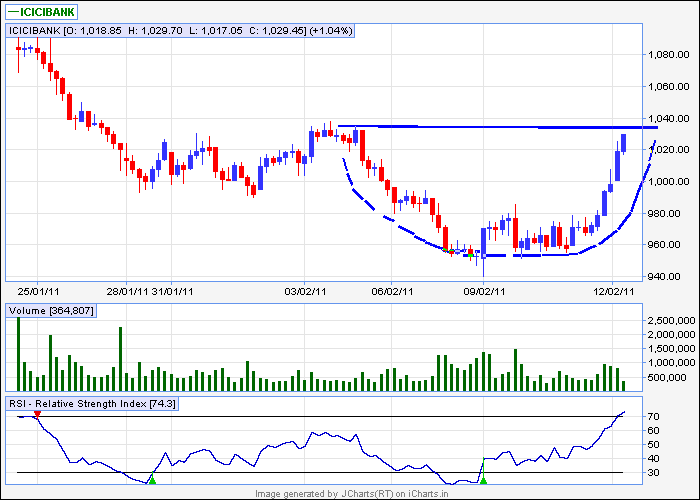
is it a big rounding bottom in icicibank?
thanks and regards
ravee
| Description: |
|
| Filesize: |
11.34 KB |
| Viewed: |
765 Time(s) |

|
|
|
| Back to top |
|
 |
casper
Green Belt

Joined: 02 Oct 2010
Posts: 1315
|
Post: #1885  Posted: Mon Feb 14, 2011 10:51 am Post subject: Posted: Mon Feb 14, 2011 10:51 am Post subject: |
 |
|
| singh.ravee wrote: | casper hello,
is it a big rounding bottom in icicibank?
thanks and regards
ravee |
yes ravee
looks like 60 rupees should be rough target
but have to go through weekly r2 and monthly pivs around 1050 range
and c class -div in 5 min charts too
(almost all major stock got it)
|
|
| Back to top |
|
 |
singh.ravee
Yellow Belt

Joined: 12 Aug 2010
Posts: 678
|
Post: #1886  Posted: Mon Feb 14, 2011 11:02 am Post subject: Posted: Mon Feb 14, 2011 11:02 am Post subject: |
 |
|
casper,
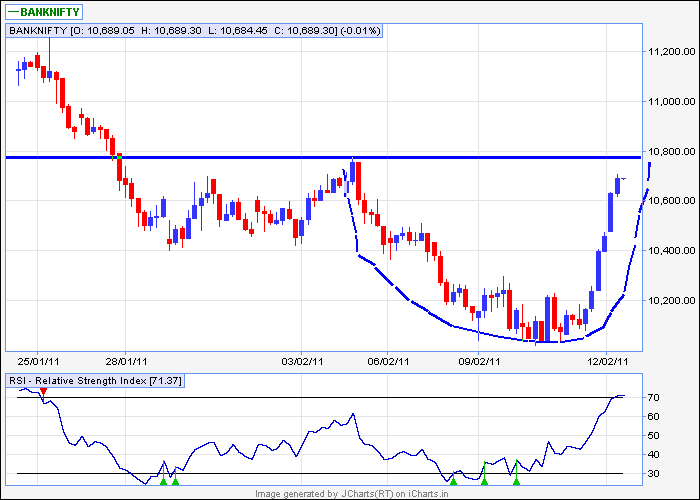
see this big big rounding bottom in banknifty. its even bigger than the previous one. its still under formation and close to neckline
thanks and regards
ravee
| Description: |
|
| Filesize: |
10.97 KB |
| Viewed: |
717 Time(s) |

|
|
|
| Back to top |
|
 |
casper
Green Belt

Joined: 02 Oct 2010
Posts: 1315
|
Post: #1887  Posted: Mon Feb 14, 2011 11:13 am Post subject: Posted: Mon Feb 14, 2011 11:13 am Post subject: |
 |
|
| singh.ravee wrote: | casper,
see this big big rounding bottom in banknifty. its even bigger than the previous one. its still under formation and close to neckline
thanks and regards
ravee |
just notice one thing
what kinds of + div it had got while it was at the bottom of the pattern,
this upmove is fueled by that +div in 60 min in all major stocks
but problem is, in lesser tf all are getting -div and still going on
now at any strong resi, these -div will start paying off or may be carried over to the higher tf
by da way, what i have seen, -div means a great fall is not true always
some times a single red candle can discount the - div
so whenever u take a position, plz check in lesser tf too, to find out the possible head room
bcoz we are still not out of wood so we need to be sure before starting a trade
|
|
| Back to top |
|
 |
chiragbvyas
White Belt

Joined: 18 Feb 2010
Posts: 469
|
Post: #1888  Posted: Mon Feb 14, 2011 11:18 am Post subject: yahoo charts Posted: Mon Feb 14, 2011 11:18 am Post subject: yahoo charts |
 |
|
anybody can help me out how to use intraday charts at finance.yahoo.com ?
it takes too much time to get refreshed. or suggest any site where rates get faster refresh ?
|
|
| Back to top |
|
 |
casper
Green Belt

Joined: 02 Oct 2010
Posts: 1315
|
Post: #1889  Posted: Mon Feb 14, 2011 11:23 am Post subject: Re: yahoo charts Posted: Mon Feb 14, 2011 11:23 am Post subject: Re: yahoo charts |
 |
|
| chiragbvyas wrote: | anybody can help me out how to use intraday charts at finance.yahoo.com ?
it takes too much time to get refreshed. or suggest any site where rates get faster refresh ? |
replied already bro
refresh it manually or try google finance
|
|
| Back to top |
|
 |
chiragbvyas
White Belt

Joined: 18 Feb 2010
Posts: 469
|
Post: #1890  Posted: Mon Feb 14, 2011 11:51 am Post subject: thanks Posted: Mon Feb 14, 2011 11:51 am Post subject: thanks |
 |
|
| thanks a lot
|
|
| Back to top |
|
 |
|

