|
|
| View previous topic :: View next topic |
| Author |
a layman's approach to break out and break down |
casper
Green Belt

Joined: 02 Oct 2010
Posts: 1315
|
Post: #196  Posted: Thu Nov 11, 2010 8:37 am Post subject: Posted: Thu Nov 11, 2010 8:37 am Post subject: |
 |
|
hi chrome, thanks for ur kind words, in fact u seniors show us the way and we follow it 
hi vishal, when u want to write that way, just hit the quote button, a reply window will be opened, and there will be some text in the following manner, [quote} the text u r quoting will be here [quote}, u have to start typing after the second quote, just place ur cursor at the end of the quote and press enter to start writing, then take a preview to see if its ok or not, the text which is covered by the two quotes will appear with ur message.
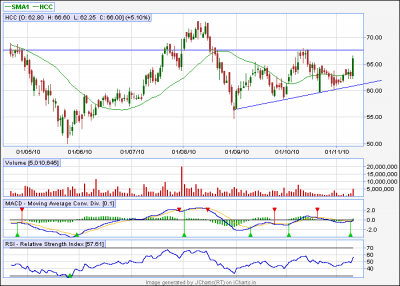
hcc has broken out imp resistance level, now we have a resistance of 67, above which it will be an ascending triangle, and the target of that triangle will be 70,72.75.80
icsa is consolidating at this level for at least 8 months or so, if it sustain above 154 then i think it will reach 190-200 within 15 days or so, though its entirely depend up on volume, if it gathers huge vol, then it will be very fast move, seeing the consolidation we can expect a huge movement, but i say again, volume holds the answer here.
educomp does not looks promising enough as yesterday it has gone down and support is seen at 540 where as resistance is at 560 as of now, the narrow range of bollinger band suggests a consolidating move is likely, price is going to oscillate with in the range, for another f&o, plz wait, let me search and i will be back in a few minutes
| Description: |
|
| Filesize: |
13.96 KB |
| Viewed: |
395 Time(s) |

|
|
|
| Back to top |
|
 |
|
|  |
mrvishal_g
White Belt

Joined: 17 Sep 2010
Posts: 89
|
Post: #197  Posted: Thu Nov 11, 2010 8:55 am Post subject: Posted: Thu Nov 11, 2010 8:55 am Post subject: |
 |
|
Thank Casper
I will wait for your pick
Vishal
|
|
| Back to top |
|
 |
casper
Green Belt

Joined: 02 Oct 2010
Posts: 1315
|
Post: #198  Posted: Thu Nov 11, 2010 9:12 am Post subject: Posted: Thu Nov 11, 2010 9:12 am Post subject: |
 |
|
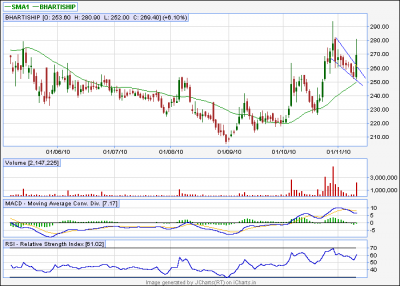
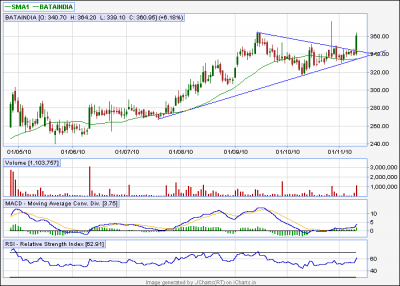
hi vishal, u can consider bata india, it has a sym, tri formation and a target of 380-400 for short term, im trying to find a few others, and if u go for cash, then u may consider bhartiship also, it has a flag pattern, target will be around 270
| Description: |
|
| Filesize: |
13.65 KB |
| Viewed: |
358 Time(s) |

|
| Description: |
|
| Filesize: |
13.75 KB |
| Viewed: |
355 Time(s) |

|
|
|
| Back to top |
|
 |
Allwell
White Belt

Joined: 24 Jan 2010
Posts: 183
|
Post: #199  Posted: Thu Nov 11, 2010 11:11 am Post subject: Posted: Thu Nov 11, 2010 11:11 am Post subject: |
 |
|
Hellow Casper,
Maruti has take support of lower BB 1460 as per your earlier post. Today its look strong, Now What ?
|
|
| Back to top |
|
 |
casper
Green Belt

Joined: 02 Oct 2010
Posts: 1315
|
Post: #200  Posted: Thu Nov 11, 2010 8:58 pm Post subject: Posted: Thu Nov 11, 2010 8:58 pm Post subject: |
 |
|
hi dijyya, sorry for late,
so, nifty down 81 points and ur maruti down only 4.70 rupees? is it justified? 
today u have seen how strong the bollinger band could be 
but nothing is ultimate, it can be broken also, and whenever its broken, the break will be decisive one,
if u still have maruti, u can start averaging now but only in installment, if today maruti were green, i would say u to go and purchase, it would become like bottom fishing then, but its a red doji, so we need to be little bit cautious
|
|
| Back to top |
|
 |
Allwell
White Belt

Joined: 24 Jan 2010
Posts: 183
|
Post: #201  Posted: Thu Nov 11, 2010 11:32 pm Post subject: Posted: Thu Nov 11, 2010 11:32 pm Post subject: |
 |
|
| casper wrote: | hi dijyya, sorry for late,
so, nifty down 81 points and ur maruti down only 4.70 rupees? is it justified? 
today u have seen how strong the bollinger band could be 
but nothing is ultimate, it can be broken also, and whenever its broken, the break will be decisive one,
if u still have maruti, u can start averaging now but only in installment, if today maruti were green, i would say u to go and purchase, it would become like bottom fishing then, but its a red doji, so we need to be little bit cautious |
Well,
Actullly I sold my earlier position in Maruti on monday @ 1518 after reading ur post and now today entered @ 1475. In BB one can see upper band and lower band, but how can I found support and regitance ?
Thanks
|
|
| Back to top |
|
 |
casper
Green Belt

Joined: 02 Oct 2010
Posts: 1315
|
Post: #202  Posted: Fri Nov 12, 2010 7:00 am Post subject: Posted: Fri Nov 12, 2010 7:00 am Post subject: |
 |
|
plz refer to that post, i hv written there that the lower band is the support and upper band is the resistance, im quoting particularly the 1st paragraph i have written there, plz go through it and it will be clear, if if u still have doubts then feel free to ask 
| casper wrote: | hi dijyya,
ur questions can be explained with bollinger band method (bb).
it is a continuous band which is derived from 20sma and envelops the price move to show the possible volatility of the security. it is generally noticed that the upper and lower bb provide the greatest resistance and support respectively. |
|
|
| Back to top |
|
 |
mrvishal_g
White Belt

Joined: 17 Sep 2010
Posts: 89
|
Post: #203  Posted: Fri Nov 12, 2010 8:53 am Post subject: Posted: Fri Nov 12, 2010 8:53 am Post subject: |
 |
|
| casper wrote: | | hi vishal, u can consider bata india, it has a sym, tri formation and a target of 380-400 for short term, im trying to find a few others, and if u go for cash, then u may consider bhartiship also, it has a flag pattern, target will be around 270 |
Thanks Casper
|
|
| Back to top |
|
 |
casper
Green Belt

Joined: 02 Oct 2010
Posts: 1315
|
Post: #204  Posted: Fri Nov 12, 2010 9:04 am Post subject: Posted: Fri Nov 12, 2010 9:04 am Post subject: |
 |
|
hi vishal, so now u have learnt how to quote!!! 
|
|
| Back to top |
|
 |
Allwell
White Belt

Joined: 24 Jan 2010
Posts: 183
|
Post: #205  Posted: Fri Nov 12, 2010 11:03 am Post subject: Posted: Fri Nov 12, 2010 11:03 am Post subject: |
 |
|
| casper wrote: | plz refer to that post, i hv written there that the lower band is the support and upper band is the resistance, im quoting particularly the 1st paragraph i have written there, plz go through it and it will be clear, if if u still have doubts then feel free to ask 
| casper wrote: | hi dijyya,
ur questions can be explained with bollinger band method (bb).
it is a continuous band which is derived from 20sma and envelops the price move to show the possible volatility of the security. it is generally noticed that the upper and lower bb provide the greatest resistance and support respectively. |
|
Thanks for your kind reply,
Actually am referring that post, in which you have mention about ONGC's BB which is 1391 and 1293 on that day, which is clear showen on charts. On that post u have also say that there is minor support at 1360 and 1340, for which I wants to know how one can find the same.
Sorry for inconvenience if any....
|
|
| Back to top |
|
 |
casper
Green Belt

Joined: 02 Oct 2010
Posts: 1315
|
Post: #206  Posted: Fri Nov 12, 2010 11:50 am Post subject: Posted: Fri Nov 12, 2010 11:50 am Post subject: |
 |
|
| dijyya wrote: | | casper wrote: | plz refer to that post, i hv written there that the lower band is the support and upper band is the resistance, im quoting particularly the 1st paragraph i have written there, plz go through it and it will be clear, if if u still have doubts then feel free to ask 
| casper wrote: | hi dijyya,
ur questions can be explained with bollinger band method (bb).
it is a continuous band which is derived from 20sma and envelops the price move to show the possible volatility of the security. it is generally noticed that the upper and lower bb provide the greatest resistance and support respectively. |
|
Thanks for your kind reply,
Actually am referring that post, in which you have mention about ONGC's BB which is 1391 and 1293 on that day, which is clear showen on charts. On that post u have also say that there is minor support at 1360 and 1340, for which I wants to know how one can find the same.
Sorry for inconvenience if any.... |
hi brother dijyya, no chance of inconvenience at all!!!
yes i wrote that it was a supportive zone between 1340-1360, though i did not say that it was mild/minor support, but u can take it like that also!! 
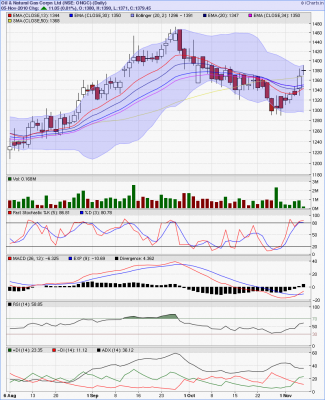
plz refer to the corresponding picture, u will see that a bunch of ema were present between 1340 to 1360 at that time, that's why i said it would be a supportive zone,since ema breaching is quite common so u can say they are temporary/ mild/minor support in comparison with bolinger band.
in fact i was supposed to mention that clearly but i didn't. im realy sorry for that brother 
now is it clear? if u have any more questions, plz feel free to ask! 
| Description: |
|
| Filesize: |
98.5 KB |
| Viewed: |
398 Time(s) |

|
|
|
| Back to top |
|
 |
casper
Green Belt

Joined: 02 Oct 2010
Posts: 1315
|
Post: #207  Posted: Fri Nov 12, 2010 11:59 am Post subject: Posted: Fri Nov 12, 2010 11:59 am Post subject: |
 |
|
just as a reference, i can say that ema/sma/wma or any kinds of moving average may give u some support/resistance, various ema can be used and is used as per one's choice, some of the important moving averages are 5.7.13.21.30.50.100,150 and 200 moving averages
while the shorter emas are good for short term trades and reacts swiftly to price actions but they can be misleading at some points
and the higher ema, they are mostly indifferent to short term price changes and mostly use to trade with mid/long term views, but they are capable to support/resist price actions much more greater than their short term counter parts
|
|
| Back to top |
|
 |
Allwell
White Belt

Joined: 24 Jan 2010
Posts: 183
|
Post: #208  Posted: Fri Nov 12, 2010 3:12 pm Post subject: Posted: Fri Nov 12, 2010 3:12 pm Post subject: |
 |
|
| Thanks again Casper for your detailed reply.
|
|
| Back to top |
|
 |
newinvestor
White Belt

Joined: 16 Feb 2010
Posts: 120
|
Post: #209  Posted: Fri Nov 12, 2010 3:34 pm Post subject: Posted: Fri Nov 12, 2010 3:34 pm Post subject: |
 |
|
| casper wrote: | just as a reference, i can say that ema/sma/wma or any kinds of moving average may give u some support/resistance, various ema can be used and is used as per one's choice, some of the important moving averages are 5.7.13.21.30.50.100,150 and 200 moving averages
while the shorter emas are good for short term trades and reacts swiftly to price actions but they can be misleading at some points
and the higher ema, they are mostly indifferent to short term price changes and mostly use to trade with mid/long term views, but they are capable to support/resist price actions much more greater than their short term counter parts |
Hi Casper. I have been trying to trade Nifty using price crossover of EMA 20 . Whats the best way to do this ( also, whats the best way to trade using Moving averages , in general ). How do you use them?
I got a couple of whipsaws today on EMA 20.
|
|
| Back to top |
|
 |
casper
Green Belt

Joined: 02 Oct 2010
Posts: 1315
|
Post: #210  Posted: Fri Nov 12, 2010 5:52 pm Post subject: Posted: Fri Nov 12, 2010 5:52 pm Post subject: |
 |
|
dijyya thanks and welcome
newinvestor, once i posted a real time chart in st sir's thread, it was a 89 ema high and 89 ema low cross over chart and i asked him to comment on that,
he precisely told me that if i use ONLY ema crossover to take a trade then i will be successful only on heavy trending days, in case of choppy and nervous trading days, ema crossover is bound to make whipsaws,
so he told me to use a trend identifier indicator,among other indicators, he told me to use adx in particular and the result was good.
if u are not very accustomed with adx, u can try to use rsi also as it is one of the very simple indicators, in case of rsi, the thumb rule will be never go long when rsi in real time chart shows over bought nad never go short when rsi is oversold
normally a shorter and a higher ema is used to trade with ema cross over, u wrote about 20 ema but did not mention the another one,
let us assume that we are using 13 ema and 20 ema crossover along with rsi,
the idea of trade will be GO LONG WHEN THE SHORTER EMA IS CROSSING AND COMING ABOVE THE HIGHER EMA AND RSI IS OVERSOLD OR RISING BUT CERTAINLY NOT OVERBOUGHT
AND GO SHORT, WHEN THE SHORTER EMA IS CROSSING THE HIGHER EMA IN A DOWNWARD MOTION AND RSI IG GOING DOWN OR OVER BOUGHT BUT CERTAINLY NOT THE OVERSOLD
the logic behind is IN CASE OF A PRICE INCREMENT , THE SHORT TIME AVERAGE WILL BE GREATER THAN THE LONG TIME AVERAGE SO THE SHORTER EMA WILL CROSS HIGHER EMA IN A UPWARD MOTION
AND IN CASE OF CORRECTION THE SHORTER AVERAGE WILL BE LESSER THAN THE HIGHER AVERAGE SO IT WILL CROSS THE HIGHER EMA IN A DOWNWARD MOTION
the rsi reading will save us from shorting at a possible bottom and buying at a possible top
in short this is the basic structure of any ema cross over strategy, and personally as i follow the break out strategy even in real time chart, so i dont use ema crossover to trade
|
|
| Back to top |
|
 |
|
|
You cannot post new topics in this forum
You cannot reply to topics in this forum
You cannot edit your posts in this forum
You cannot delete your posts in this forum
You cannot vote in polls in this forum
You can attach files in this forum
You can download files in this forum
|
Powered by phpBB © 2001, 2005 phpBB Group
|
|
|

