| View previous topic :: View next topic |
| Author |
a layman's approach to break out and break down |
technocalls
White Belt

Joined: 27 Aug 2010
Posts: 34
|
Post: #1951  Posted: Wed Feb 16, 2011 9:52 am Post subject: Posted: Wed Feb 16, 2011 9:52 am Post subject: |
 |
|
hi casper,
good morning recently u r using "broadening top formation ". what is that ??? can u explain it .....
|
|
| Back to top |
|
 |
|
|
 |
ESNMURTY
White Belt

Joined: 31 Oct 2009
Posts: 380
|
Post: #1952  Posted: Wed Feb 16, 2011 9:56 am Post subject: Posted: Wed Feb 16, 2011 9:56 am Post subject: |
 |
|
| Dear Casper, CAIRN looks weak below 320..How good is to trade this?
|
|
| Back to top |
|
 |
casper
Green Belt

Joined: 02 Oct 2010
Posts: 1315
|
Post: #1953  Posted: Wed Feb 16, 2011 10:02 am Post subject: Posted: Wed Feb 16, 2011 10:02 am Post subject: |
 |
|
| ESNMURTY wrote: | | Dear Casper, CAIRN looks weak below 320..How good is to trade this? |
monthly and weekly level converging at 320
plz check
its weak below 320 and strong to choppy above that
its a sell ofcourse below 320 with a sl above 320
|
|
| Back to top |
|
 |
singh.ravee
Yellow Belt

Joined: 12 Aug 2010
Posts: 678
|
Post: #1954  Posted: Wed Feb 16, 2011 10:02 am Post subject: Posted: Wed Feb 16, 2011 10:02 am Post subject: |
 |
|
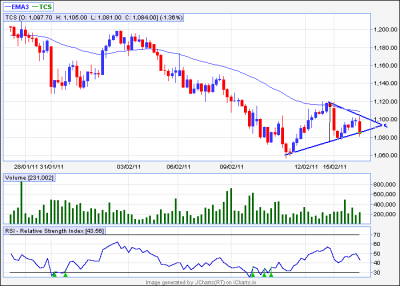
casper hello,
is it a st break down in tcs 60min
tgt = 1040
sl= 1090
thanks and regards
ravee
| Description: |
|
| Filesize: |
23.46 KB |
| Viewed: |
202 Time(s) |

|
|
|
| Back to top |
|
 |
casper
Green Belt

Joined: 02 Oct 2010
Posts: 1315
|
Post: #1955  Posted: Wed Feb 16, 2011 10:03 am Post subject: Posted: Wed Feb 16, 2011 10:03 am Post subject: |
 |
|
| technocalls wrote: | hi casper,
good morning recently u r using "broadening top formation ". what is that ??? can u explain it ..... |
ok i will explain
plz wait, i hv some open position already in the market
|
|
| Back to top |
|
 |
casper
Green Belt

Joined: 02 Oct 2010
Posts: 1315
|
Post: #1956  Posted: Wed Feb 16, 2011 10:59 am Post subject: Posted: Wed Feb 16, 2011 10:59 am Post subject: |
 |
|
| singh.ravee wrote: | casper hello,
is it a st break down in tcs 60min
tgt = 1040
sl= 1090
thanks and regards
ravee |
sorry for late ravee
im fighting wid hindalco still
looks like its a bd, now plz folow lesser tf to see any div and one more thing
today the prime minister may announce for JPC, market may move up if we have a positive development
so plz be careful
|
|
| Back to top |
|
 |
singh.ravee
Yellow Belt

Joined: 12 Aug 2010
Posts: 678
|
Post: #1957  Posted: Wed Feb 16, 2011 12:15 pm Post subject: Posted: Wed Feb 16, 2011 12:15 pm Post subject: |
 |
|
hindalco on which side - long or short
ravee
|
|
| Back to top |
|
 |
casper
Green Belt

Joined: 02 Oct 2010
Posts: 1315
|
Post: #1958  Posted: Wed Feb 16, 2011 12:45 pm Post subject: Posted: Wed Feb 16, 2011 12:45 pm Post subject: |
 |
|
| singh.ravee wrote: | hindalco on which side - long or short
ravee |
short
shorted in morning at a dt in 60/15 min chart at 211.50 and covered at 208.50
|
|
| Back to top |
|
 |
ESNMURTY
White Belt

Joined: 31 Oct 2009
Posts: 380
|
Post: #1959  Posted: Wed Feb 16, 2011 1:41 pm Post subject: Posted: Wed Feb 16, 2011 1:41 pm Post subject: |
 |
|
| Dear Casper, Is there a possible bo in 60 tf AT of BIOCON .. Kindly advise
|
|
| Back to top |
|
 |
casper
Green Belt

Joined: 02 Oct 2010
Posts: 1315
|
Post: #1960  Posted: Wed Feb 16, 2011 2:05 pm Post subject: Posted: Wed Feb 16, 2011 2:05 pm Post subject: |
 |
|
| ESNMURTY wrote: | | Dear Casper, Is there a possible bo in 60 tf AT of BIOCON .. Kindly advise |
biocon is not an AT in 60 min tf
as per basic chart, weekly r1 is present at 345
try to enter above it
|
|
| Back to top |
|
 |
ESNMURTY
White Belt

Joined: 31 Oct 2009
Posts: 380
|
Post: #1961  Posted: Thu Feb 17, 2011 11:12 am Post subject: Posted: Thu Feb 17, 2011 11:12 am Post subject: |
 |
|
| Dear Casper, Kindly confirm if there is bo in 60tf AT in Bajaj hindusthan above 79.40
|
|
| Back to top |
|
 |
casper
Green Belt

Joined: 02 Oct 2010
Posts: 1315
|
Post: #1962  Posted: Thu Feb 17, 2011 11:18 am Post subject: Posted: Thu Feb 17, 2011 11:18 am Post subject: |
 |
|
| ESNMURTY wrote: | | Dear Casper, Kindly confirm if there is bo in 60tf AT in Bajaj hindusthan above 79.40 |
yes, buy above 89 ema at 80 and target weekly r1at 82.75
wait and buy on bo only
|
|
| Back to top |
|
 |
ESNMURTY
White Belt

Joined: 31 Oct 2009
Posts: 380
|
Post: #1963  Posted: Thu Feb 17, 2011 11:21 am Post subject: Posted: Thu Feb 17, 2011 11:21 am Post subject: |
 |
|
Thanks Casperji... | casper wrote: | | ESNMURTY wrote: | | Dear Casper, Kindly confirm if there is bo in 60tf AT in Bajaj hindusthan above 79.40 |
yes, buy above 89 ema at 80 and target weekly r1at 82.75
wait and buy on bo only |
|
|
| Back to top |
|
 |
sumesh_sol
Brown Belt

Joined: 06 Jun 2010
Posts: 2344
|
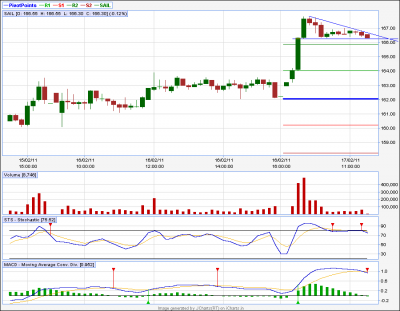
Post: #1964  Posted: Thu Feb 17, 2011 11:23 am Post subject: sail 10tf Posted: Thu Feb 17, 2011 11:23 am Post subject: sail 10tf |
 |
|
sail 10tf
**********
Looks like Dt on 10tf...
Below 166 we can expect 164.5/164...
-Sumesh
| Description: |
|
| Filesize: |
15.46 KB |
| Viewed: |
202 Time(s) |

|
|
|
| Back to top |
|
 |
casper
Green Belt

Joined: 02 Oct 2010
Posts: 1315
|
|
| Back to top |
|
 |
|

