| View previous topic :: View next topic |
| Author |
a layman's approach to break out and break down |
casper
Green Belt

Joined: 02 Oct 2010
Posts: 1315
|
Post: #1966  Posted: Thu Feb 17, 2011 11:31 am Post subject: Posted: Thu Feb 17, 2011 11:31 am Post subject: |
 |
|
sorry, hv not written the scrip name
its adanient
|
|
| Back to top |
|
 |
|
|
 |
sumesh_sol
Brown Belt

Joined: 06 Jun 2010
Posts: 2344
|
Post: #1967  Posted: Thu Feb 17, 2011 11:32 am Post subject: Re: sail 10tf Posted: Thu Feb 17, 2011 11:32 am Post subject: Re: sail 10tf |
 |
|
| casper wrote: | | sumesh_sol wrote: | sail 10tf
**********
Looks like Dt on 10tf...
Below 166 we can expect 164.5/164...
-Sumesh |
hi sumesh bhai, u working???
im reading elder and noting important quotes, market is too boring to watch
look at the wedge, im following it for last 1 hr and reading book
we can sell it if its broken in my like time, target 607, weekly r1
cmp 628
   |
Hi dear,
Yes I'm trying to adjust both office and market.. And this book I just love this, already completed 50%.. reading daily and learning good things..
Not sure of wedges, never played them..
-Sumesh
|
|
| Back to top |
|
 |
ESNMURTY
White Belt

Joined: 31 Oct 2009
Posts: 380
|
Post: #1968  Posted: Thu Feb 17, 2011 11:40 am Post subject: Posted: Thu Feb 17, 2011 11:40 am Post subject: |
 |
|
Dear Casperji, PUNJLLOYD BO AT 60tf and above weekly pivot can be bought at 75.80 now
Last edited by ESNMURTY on Thu Feb 17, 2011 11:45 am; edited 1 time in total |
|
| Back to top |
|
 |
casper
Green Belt

Joined: 02 Oct 2010
Posts: 1315
|
Post: #1969  Posted: Thu Feb 17, 2011 11:42 am Post subject: Posted: Thu Feb 17, 2011 11:42 am Post subject: |
 |
|
its really wonderful book
even if a non trader starts reading, may not stop before finishing it, im at 172 page
but hv to read numerous time even after i finish it
i think, being a psychologist, DR. ELDER has made it so simple and addressed directly to the point
u rightly wrote that who ever reads it, will feel that this book is written only for him as if the ELDER is talking to u, like ur elder brother
|
|
| Back to top |
|
 |
casper
Green Belt

Joined: 02 Oct 2010
Posts: 1315
|
Post: #1970  Posted: Thu Feb 17, 2011 11:47 am Post subject: Posted: Thu Feb 17, 2011 11:47 am Post subject: |
 |
|
| ESNMURTY wrote: | | Dear Casperji, PUNJLLOYD BO AT 60tf and above mly pivot can be bought at 75.80 now |
hii
its on weekly piv at 74.95
if it stays above that then buy, check volume too
range bound market is like a sky with too much cloud and no wind at all
an indication of incoming storm
and plz dont call me casper ji
u know, im one of the youngest ichartians
  
|
|
| Back to top |
|
 |
sumesh_sol
Brown Belt

Joined: 06 Jun 2010
Posts: 2344
|
Post: #1971  Posted: Thu Feb 17, 2011 12:15 pm Post subject: Re: sail 10tf Posted: Thu Feb 17, 2011 12:15 pm Post subject: Re: sail 10tf |
 |
|
| sumesh_sol wrote: | sail 10tf
**********
Looks like Dt on 10tf...
Below 166 we can expect 164.5/164...
-Sumesh |
Exited at cost as not falling much despite STS oversold in 10tf...
|
|
| Back to top |
|
 |
capsi
White Belt

Joined: 04 Dec 2010
Posts: 18
|
Post: #1972  Posted: Thu Feb 17, 2011 2:01 pm Post subject: Posted: Thu Feb 17, 2011 2:01 pm Post subject: |
 |
|
| is there any chance of DLF crossing 240, b4 or on expiry ?
|
|
| Back to top |
|
 |
capsi
White Belt

Joined: 04 Dec 2010
Posts: 18
|
Post: #1973  Posted: Thu Feb 17, 2011 2:02 pm Post subject: Posted: Thu Feb 17, 2011 2:02 pm Post subject: |
 |
|
| is there any chance of DLF crossing 240, b4 or on expiry ?
|
|
| Back to top |
|
 |
drsureshbs
White Belt

Joined: 22 Oct 2008
Posts: 58
|
Post: #1974  Posted: Fri Feb 18, 2011 12:51 am Post subject: Posted: Fri Feb 18, 2011 12:51 am Post subject: |
 |
|
Dear Casper i hav observed that i get diff readings for pivot r1 r2 s1 s2wen i plot pivots on diff time frame in diff windows with diff no of days of historical data. which one to follow or am i wrong some where eg evoron sys hourly chart with 220 days data and 5mts chart with 7days data wen u applly weekly pivot
on both the charts uget diff reading
pl clearify
|
|
| Back to top |
|
 |
ragarwal
Yellow Belt

Joined: 16 Nov 2008
Posts: 582
|
Post: #1975  Posted: Fri Feb 18, 2011 2:01 am Post subject: Posted: Fri Feb 18, 2011 2:01 am Post subject: |
 |
|
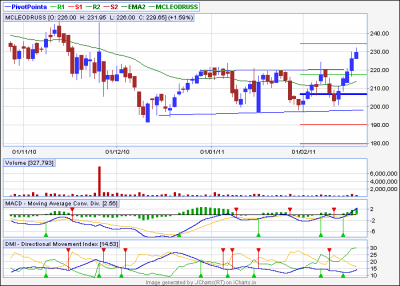
| dear casper,seems mcleod russel is abot to breakout,macd is in positiv and broken past the 0 level,20dema is just crossing the 50 dema though volumes r lacking.how far can this one go,if i am ryt.one more thinh i noticed that this time the stock did not break down with the markets,markets were down by more than 20 percent but it showed resilience.it has been trading in a rectangle,n now broken out.wat can b the trgets fr it?
|
|
| Back to top |
|
 |
casper
Green Belt

Joined: 02 Oct 2010
Posts: 1315
|
Post: #1976  Posted: Fri Feb 18, 2011 9:06 am Post subject: Posted: Fri Feb 18, 2011 9:06 am Post subject: |
 |
|
| drsureshbs wrote: | Dear Casper i hav observed that i get diff readings for pivot r1 r2 s1 s2wen i plot pivots on diff time frame in diff windows with diff no of days of historical data. which one to follow or am i wrong some where eg evoron sys hourly chart with 220 days data and 5mts chart with 7days data wen u applly weekly pivot
on both the charts uget diff reading
pl clearify |
when i switch on the piv points, i generally follow a fixed number of days and i get same data for all tf
u know i do a trick here
i really dont know how many number of days i may get in my pc, it depends of my cpu and ram
so i have earmarked the maximum possible days and let my computer decide how much days data it can download
right now i have intra data from october, as days will go on, the past days will be deleted one by one and newer one will be added, so total nuber of days is constant
by this method, what i get as pivot data is more or less at par with others and they provide good sup/resi too
so i never changed number of days
u plz try it and if still problem persist, plz bring it to the notice of support team
|
|
| Back to top |
|
 |
casper
Green Belt

Joined: 02 Oct 2010
Posts: 1315
|
Post: #1977  Posted: Fri Feb 18, 2011 9:12 am Post subject: Posted: Fri Feb 18, 2011 9:12 am Post subject: |
 |
|
| ragarwal wrote: | | dear casper,seems mcleod russel is abot to breakout,macd is in positiv and broken past the 0 level,20dema is just crossing the 50 dema though volumes r lacking.how far can this one go,if i am ryt.one more thinh i noticed that this time the stock did not break down with the markets,markets were down by more than 20 percent but it showed resilience.it has been trading in a rectangle,n now broken out.wat can b the trgets fr it? |
in eod chart i see a channel in mcleodruss, it has broken out of channel and the width of the channel, at least in theory, should be our target, that gives a target around 260
now it broken out but without volume and monthly r2 level is drawing on , so i think 233 should become a stop for this stock
here, my subscription is gone so i can not go for more minute analysis at this moment, u plz wait, i will update u as soon as i get intra data
| Description: |
|
| Filesize: |
13.36 KB |
| Viewed: |
204 Time(s) |

|
|
|
| Back to top |
|
 |
casper
Green Belt

Joined: 02 Oct 2010
Posts: 1315
|
Post: #1978  Posted: Fri Feb 18, 2011 9:19 am Post subject: Posted: Fri Feb 18, 2011 9:19 am Post subject: |
 |
|
| capsi wrote: | | is there any chance of DLF crossing 240, b4 or on expiry ? |
hi capsi (ur id is quite similar to mine!!)
right now dlf is under both monthly pivot at 246 and weekly pivot at 242
altogether this zone has become too tough resistance to break in normal case
below,we have support at 233, so chance is there to fall below that support if that support is gone
from eod chart i feel below 233, 220 is more likely
i will update u as soon as i get intra data, my current subs is over last night and i forget to renew
i hope i will get intra data in half an hour and i will update u then if i found any thing other than these points in intra chart
|
|
| Back to top |
|
 |
casper
Green Belt

Joined: 02 Oct 2010
Posts: 1315
|
Post: #1979  Posted: Fri Feb 18, 2011 9:42 am Post subject: Posted: Fri Feb 18, 2011 9:42 am Post subject: |
 |
|
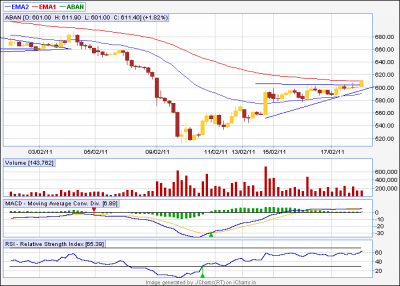
aban in 60 min chart
forming AT
resi now 89 ema and monthly s1
we can buy above that and target 625.630
| Description: |
|
| Filesize: |
12.28 KB |
| Viewed: |
195 Time(s) |

|
|
|
| Back to top |
|
 |
ESNMURTY
White Belt

Joined: 31 Oct 2009
Posts: 380
|
Post: #1980  Posted: Fri Feb 18, 2011 10:15 am Post subject: Posted: Fri Feb 18, 2011 10:15 am Post subject: |
 |
|
| Dear Casper, Can I enter Mphasis at these levels and what could be the stoploss and the prob target
|
|
| Back to top |
|
 |
|

