| View previous topic :: View next topic |
| Author |
a layman's approach to break out and break down |
ridinghood
Yellow Belt

Joined: 16 Apr 2009
Posts: 724
|
Post: #1996  Posted: Sat Feb 19, 2011 3:36 pm Post subject: Posted: Sat Feb 19, 2011 3:36 pm Post subject: |
 |
|
HI CASPER
thnx a lot for ur quick nd clear guidance about ranbaxy.it is amazing really where do u get so much energy from so as to put up with endless amount of load novices like me keep on feeding u ! hats off to ur spirit nd enthusiasm!
regs
ridinghood
|
|
| Back to top |
|
 |
|
|
 |
technocalls
White Belt

Joined: 27 Aug 2010
Posts: 34
|
Post: #1997  Posted: Sun Feb 20, 2011 12:53 am Post subject: Posted: Sun Feb 20, 2011 12:53 am Post subject: |
 |
|
hi casper
thanx 4 the reply i had read on some site abt it but it was not good as what u said...so thanx again...
|
|
| Back to top |
|
 |
casper
Green Belt

Joined: 02 Oct 2010
Posts: 1315
|
|
| Back to top |
|
 |
newinvestor
White Belt

Joined: 16 Feb 2010
Posts: 120
|
Post: #1999  Posted: Sun Feb 20, 2011 11:14 am Post subject: Posted: Sun Feb 20, 2011 11:14 am Post subject: |
 |
|
Dear Casper,
Congrats on our thread reaching 200 pages. Shows how enthusisatic everyone is , and how well you are responding to the queries from everyone. keep it up.
Thanks also to all the others who are participating / contributing so energetically.
Casper, in your Chart 22, what is the EMA s that you have used ?
All the best
chart 22 shows us a + div in lesser tf, which i feel would result in some pullback or a gap up opening on Monday, i am talking about an intra pull back, i am not bullish
|
|
| Back to top |
|
 |
casper
Green Belt

Joined: 02 Oct 2010
Posts: 1315
|
Post: #2000  Posted: Sun Feb 20, 2011 11:42 am Post subject: Posted: Sun Feb 20, 2011 11:42 am Post subject: |
 |
|
| newinvestor wrote: | Dear Casper,
Congrats on our thread reaching 200 pages. Shows how enthusisatic everyone is , and how well you are responding to the queries from everyone. keep it up.
Thanks also to all the others who are participating / contributing so energetically.
Casper, in your Chart 22, what is the EMA s that you have used ?
All the best
chart 22 shows us a + div in lesser tf, which i feel would result in some pullback or a gap up opening on Monday, i am talking about an intra pull back, i am not bullish |
hii newinvestor
thanks, i have not checked that we are in 200th page now, yes it is an achievement for us and though u mentioned my replies but i feel without all of ur enthusiastic participation, this thread wont reach here
after ur pointing out of 200 page, i really feel lucky and feeling this day is so special for me
  
my emas in chart number 22 is 34 and 89 ema respectively, i mostly use both of these emas in all real time charts, in case of eod charts, i replace 89 with much shorter 13ema as i saw 89 ema in eod is more or less non responsive to the price action
in all my real time chart, u will see 34/89 combination, always
(it is borrowed from ST SIR's thread)
|
|
| Back to top |
|
 |
singh.ravee
Yellow Belt

Joined: 12 Aug 2010
Posts: 678
|
Post: #2001  Posted: Mon Feb 21, 2011 7:25 pm Post subject: Posted: Mon Feb 21, 2011 7:25 pm Post subject: |
 |
|
Casper bhai,
Congrats for 200pgs mark. Entire day didn't hear anything from you. Hope you are doing gr8.
Thanks and Regards
ravee
|
|
| Back to top |
|
 |
singh.ravee
Yellow Belt

Joined: 12 Aug 2010
Posts: 678
|
Post: #2002  Posted: Mon Feb 21, 2011 9:23 pm Post subject: Posted: Mon Feb 21, 2011 9:23 pm Post subject: |
 |
|
Casper,
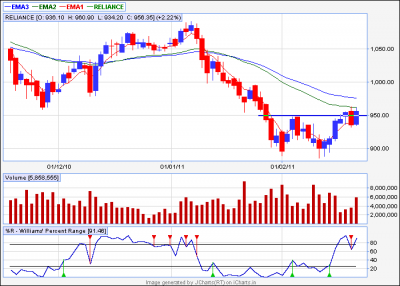
Is it a high volume double bottom breakout in ril eod.
thanks and regards
ravee
| Description: |
|
| Filesize: |
11.89 KB |
| Viewed: |
237 Time(s) |

|
|
|
| Back to top |
|
 |
casper
Green Belt

Joined: 02 Oct 2010
Posts: 1315
|
Post: #2003  Posted: Mon Feb 21, 2011 10:16 pm Post subject: Posted: Mon Feb 21, 2011 10:16 pm Post subject: |
 |
|
| singh.ravee wrote: | Casper,
Is it a high volume double bottom breakout in ril eod.
thanks and regards
ravee |
hi ravee thanks
RIL is a bo, but volume is not that significant for me and we have some of the toughest resistance ahead, such as 34 ema and monthly pivot
so i will rather try to short it tomorrow, it will be a buy for btst or short term, if it clears monthly pivot too (970 aprox)
|
|
| Back to top |
|
 |
drsureshbs
White Belt

Joined: 22 Oct 2008
Posts: 58
|
Post: #2004  Posted: Tue Feb 22, 2011 12:45 am Post subject: Posted: Tue Feb 22, 2011 12:45 am Post subject: |
 |
|
| Casper congrates on ur double century
|
|
| Back to top |
|
 |
casper
Green Belt

Joined: 02 Oct 2010
Posts: 1315
|
Post: #2005  Posted: Tue Feb 22, 2011 8:23 am Post subject: Posted: Tue Feb 22, 2011 8:23 am Post subject: |
 |
|
| drsureshbs wrote: | | Casper congrates on ur double century |
thanks drsureshbs
but its not mine alone, its our double century
  
|
|
| Back to top |
|
 |
singh.ravee
Yellow Belt

Joined: 12 Aug 2010
Posts: 678
|
Post: #2006  Posted: Tue Feb 22, 2011 1:15 pm Post subject: Posted: Tue Feb 22, 2011 1:15 pm Post subject: |
 |
|
casper hello,
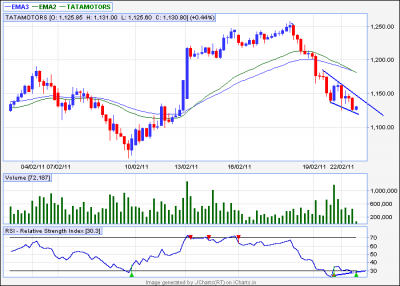
is it a falling wedge in tatamotors 60 min. If yes, how to trade it.
thanks and regards
ravee
| Description: |
|
| Filesize: |
12.34 KB |
| Viewed: |
264 Time(s) |

|
|
|
| Back to top |
|
 |
casper
Green Belt

Joined: 02 Oct 2010
Posts: 1315
|
Post: #2007  Posted: Tue Feb 22, 2011 7:59 pm Post subject: Posted: Tue Feb 22, 2011 7:59 pm Post subject: |
 |
|
| singh.ravee wrote: | casper hello,
is it a falling wedge in tatamotors 60 min. If yes, how to trade it.
thanks and regards
ravee |
yes ravee it looks like a falling wedge
also notice the + div here
1144 is weekly s1, we can go long above that level with a sl below this 1144 by closing
while 1175 can be 1st target for partial booking, we can book in full at 1200 (very tough to cross 1200 in a single hit)
|
|
| Back to top |
|
 |
prasenjit
White Belt

Joined: 31 Dec 2010
Posts: 59
|
Post: #2008  Posted: Tue Feb 22, 2011 8:12 pm Post subject: Posted: Tue Feb 22, 2011 8:12 pm Post subject: |
 |
|
| Dada tisco and nifty ki bujhcho......
|
|
| Back to top |
|
 |
singh.ravee
Yellow Belt

Joined: 12 Aug 2010
Posts: 678
|
|
| Back to top |
|
 |
casper
Green Belt

Joined: 02 Oct 2010
Posts: 1315
|
Post: #2010  Posted: Tue Feb 22, 2011 11:00 pm Post subject: Posted: Tue Feb 22, 2011 11:00 pm Post subject: |
 |
|
which one ravee? the nifty trade u already took or the fresh one?
|
|
| Back to top |
|
 |
|

