| View previous topic :: View next topic |
| Author |
a layman's approach to break out and break down |
as4manju
White Belt

Joined: 22 Mar 2007
Posts: 390
|
|
| Back to top |
|
 |
|
|
 |
ridinghood
Yellow Belt

Joined: 16 Apr 2009
Posts: 724
|
Post: #2042  Posted: Tue Mar 01, 2011 9:06 am Post subject: Posted: Tue Mar 01, 2011 9:06 am Post subject: |
 |
|
Hi casper
thnx alot for ur quick response
regs
ridinghood
|
|
| Back to top |
|
 |
casper
Green Belt

Joined: 02 Oct 2010
Posts: 1315
|
Post: #2043  Posted: Tue Mar 01, 2011 9:13 am Post subject: Posted: Tue Mar 01, 2011 9:13 am Post subject: |
 |
|
ii manju, nice observations...as usual..  
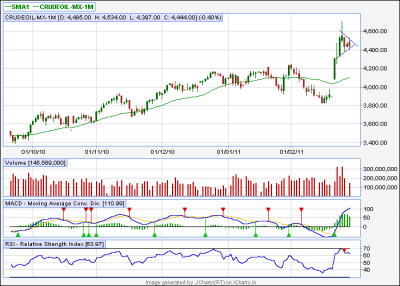
ur flag is valid one from every aspects, but i am interpreting it as symmetrical triangle/pennant formation (u can say... just to soothe my nerves  ) )
and one prayer to HOLY MOTHER from my side
we already have one high with over bought rsi in eod chart, let there be another high and give us some strong -ve div in rsi so that crude can fall
u know, situation looks very dark, though some of us still believes nifty is correcting, but i am too bearish (positionally)
if these things goes on then we will see 5050 in this week itself and after hitting the bottom, wherever it is, it does not guarantee a rise from there
we may have a prolonged consolidation, which will kill a trader, being a trader im not afraid of rise or fall.
but brother, i am really afraid of consolidation
| Description: |
|
| Filesize: |
13.25 KB |
| Viewed: |
273 Time(s) |
|
|
|
| Back to top |
|
 |
prasenjit
White Belt

Joined: 31 Dec 2010
Posts: 59
|
Post: #2044  Posted: Tue Mar 01, 2011 9:26 am Post subject: Posted: Tue Mar 01, 2011 9:26 am Post subject: |
 |
|
| casperda ...thank u .....wish u a nice day ahead.....
|
|
| Back to top |
|
 |
anand1234
Yellow Belt

Joined: 17 Jul 2010
Posts: 830
|
Post: #2045  Posted: Tue Mar 01, 2011 10:49 am Post subject: Posted: Tue Mar 01, 2011 10:49 am Post subject: |
 |
|
hi....casper
nf is above 5420 according to u................how much u can expect from here.........(kota upore jete pare............ektu guide kore dao)
thanks
anand
|
|
| Back to top |
|
 |
casper
Green Belt

Joined: 02 Oct 2010
Posts: 1315
|
Post: #2046  Posted: Tue Mar 01, 2011 11:18 am Post subject: Posted: Tue Mar 01, 2011 11:18 am Post subject: |
 |
|
if we stay above 5435, then 5465-5475 range as per spot for intra
around that range, rsi may become ob so we need to check there
  
future chart nei, aami basic member

|
|
| Back to top |
|
 |
casper
Green Belt

Joined: 02 Oct 2010
Posts: 1315
|
Post: #2047  Posted: Tue Mar 01, 2011 11:36 am Post subject: Posted: Tue Mar 01, 2011 11:36 am Post subject: |
 |
|
nifty may start going down now, if not sustain above 5435, and rsi divergence is coming, watch out
plz keep sl for ur longs, as of now , i think 5427 in spot should be sl
|
|
| Back to top |
|
 |
prasenjit
White Belt

Joined: 31 Dec 2010
Posts: 59
|
Post: #2048  Posted: Tue Mar 01, 2011 11:38 am Post subject: Posted: Tue Mar 01, 2011 11:38 am Post subject: |
 |
|
| casperda tomar sathe ki bhabe kotha bola jaye
|
|
| Back to top |
|
 |
casper
Green Belt

Joined: 02 Oct 2010
Posts: 1315
|
Post: #2049  Posted: Tue Mar 01, 2011 12:23 pm Post subject: Posted: Tue Mar 01, 2011 12:23 pm Post subject: |
 |
|
| prasenjit wrote: | | casperda tomar sathe ki bhabe kotha bola jaye |
cant post my contact info, u can ask me always in forum or u can use private msg also
to use private msg just check at the upper section of forum
  
|
|
| Back to top |
|
 |
singh.ravee
Yellow Belt

Joined: 12 Aug 2010
Posts: 678
|
Post: #2050  Posted: Tue Mar 01, 2011 6:26 pm Post subject: Posted: Tue Mar 01, 2011 6:26 pm Post subject: |
 |
|
Casper Bhai Hello,
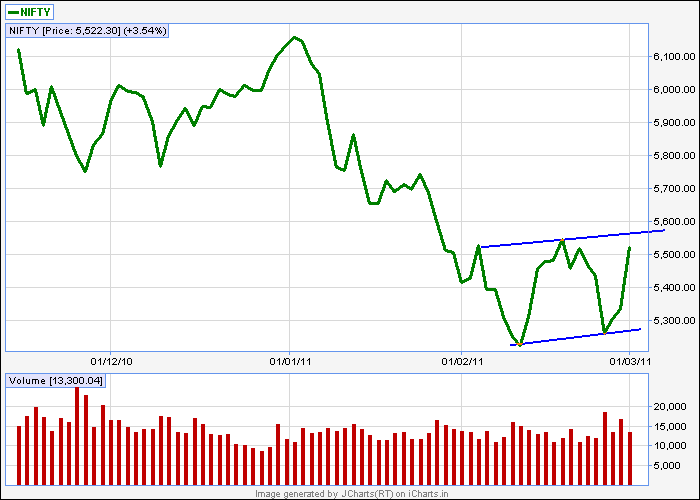
Hope you are doing great. I am attaching a chart of nifty eod. Although I am reading it as a lateral kind of movement, however, I felt its double bottom in making in nifty eod with neckline around 5570.
I wish to learn one thing, do we need to have a horizontal bottom or this kind of upward sloping bottoms can be considered as double bottom.
Keep sharing your trades with us.
Thanks and Regards
ravee
| Description: |
|
| Filesize: |
9.51 KB |
| Viewed: |
1008 Time(s) |
|
|
|
| Back to top |
|
 |
singh.ravee
Yellow Belt

Joined: 12 Aug 2010
Posts: 678
|
Post: #2051  Posted: Tue Mar 01, 2011 7:49 pm Post subject: Posted: Tue Mar 01, 2011 7:49 pm Post subject: |
 |
|
Casper,
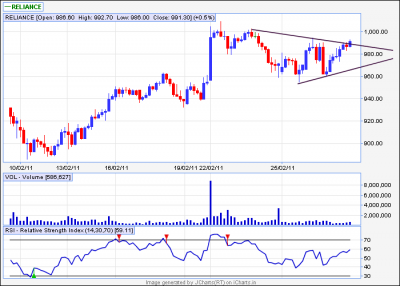
I am attaching chart of reliance in 60min. A ST in ril. I am bit confused as far as volume part is concerned.
Kindly share your valuable observation on volume part of this ST.
Thanks and Regards
Ravee
| Description: |
|
| Filesize: |
16.88 KB |
| Viewed: |
248 Time(s) |
|
|
|
| Back to top |
|
 |
casper
Green Belt

Joined: 02 Oct 2010
Posts: 1315
|
Post: #2052  Posted: Tue Mar 01, 2011 8:37 pm Post subject: Posted: Tue Mar 01, 2011 8:37 pm Post subject: |
 |
|
| singh.ravee wrote: | Casper Bhai Hello,
Hope you are doing great. I am attaching a chart of nifty eod. Although I am reading it as a lateral kind of movement, however, I felt its double bottom in making in nifty eod with neckline around 5570.
I wish to learn one thing, do we need to have a horizontal bottom or this kind of upward sloping bottoms can be considered as double bottom.
Keep sharing your trades with us.
Thanks and Regards
ravee |
if u take some liberty then u can call it double bottom, but its actually a higher bottom
by da way, double bottom is so special simply bcoz it gives us bo, if this set up gives us strong move above the recent high then alright
|
|
| Back to top |
|
 |
casper
Green Belt

Joined: 02 Oct 2010
Posts: 1315
|
Post: #2053  Posted: Tue Mar 01, 2011 8:45 pm Post subject: Posted: Tue Mar 01, 2011 8:45 pm Post subject: |
 |
|
| singh.ravee wrote: | Casper,
I am attaching chart of reliance in 60min. A ST in ril. I am bit confused as far as volume part is concerned.
Kindly share your valuable observation on volume part of this ST.
Thanks and Regards
Ravee |
during formation the volume was ok, as it was consolidating, but a break out with out added volume is always suspicious, it may come back within the pattern soon
generally, i avoid bo/bd without volume, only if the market itself is less volume one then i consider them true
a low volume means, in simple terms, ppls are less enthusiastic about the asset, its not a good sign, it can always give an up move, but we are traders we need to be disciplined thats why, i personally, wont trade any less vol bo/bd
|
|
| Back to top |
|
 |
technocalls
White Belt

Joined: 27 Aug 2010
Posts: 34
|
Post: #2054  Posted: Wed Mar 02, 2011 12:13 am Post subject: Posted: Wed Mar 02, 2011 12:13 am Post subject: |
 |
|
hi All
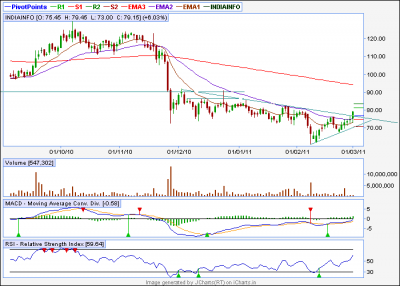
from last two days market gives big surprises ... today on upperside. i m attaching chart of indiainfo i thing it can move up to 86. what others say about it ????
| Description: |
|
| Filesize: |
11.97 KB |
| Viewed: |
279 Time(s) |
|
|
|
| Back to top |
|
 |
sumesh_sol
Brown Belt

Joined: 06 Jun 2010
Posts: 2344
|
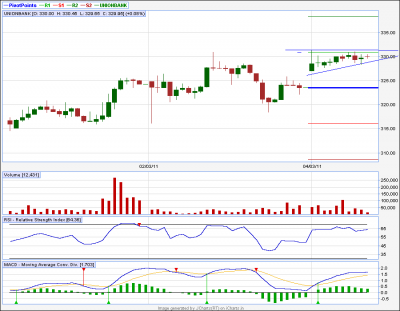
Post: #2055  Posted: Fri Mar 04, 2011 11:42 am Post subject: UNIONBANK Posted: Fri Mar 04, 2011 11:42 am Post subject: UNIONBANK |
 |
|
UNIONBANK ..15tf...
**********************
AT being formed at top.. Break above 331.5 can take it to 336/338
Regards,
Sumesh
| Description: |
|
| Filesize: |
13.16 KB |
| Viewed: |
265 Time(s) |
|
|
|
| Back to top |
|
 |
|

