|
|
| View previous topic :: View next topic |
| Author |
a layman's approach to break out and break down |
vishytns
White Belt

Joined: 26 Nov 2009
Posts: 206
|
Post: #2056  Posted: Fri Mar 04, 2011 7:17 pm Post subject: Posted: Fri Mar 04, 2011 7:17 pm Post subject: |
 |
|
Casper,
we are missing u man. Where are u? Don't stop posting. These are many ichartians voice. Comeback brother.
Vishy
|
|
| Back to top |
|
 |
|
|  |
singh.ravee
Yellow Belt

Joined: 12 Aug 2010
Posts: 678
|
Post: #2057  Posted: Fri Mar 04, 2011 9:37 pm Post subject: Posted: Fri Mar 04, 2011 9:37 pm Post subject: |
 |
|
| vishytns wrote: | Casper,
we are missing u man. Where are u? Don't stop posting. These are many ichartians voice. Comeback brother.
Vishy |
I support the noble cause of Vishy 
|
|
| Back to top |
|
 |
casper
Green Belt

Joined: 02 Oct 2010
Posts: 1315
|
Post: #2058  Posted: Sat Mar 05, 2011 9:28 am Post subject: Posted: Sat Mar 05, 2011 9:28 am Post subject: |
 |
|
hiii vishy and ravee
right now, due to roller coaster movement in nifty, about which i will frankly say, i could not make any head and tail, as there is price osculations so no set up is really forming and due to crude dancing in world stage whose tune setter is good old Gaddafi and his "kind hearted" protesters, no divergence is really working, so market looks like a "sweet" hell which is enough to finish peoples like me, thats why i am enjoying a vacation form nse
u know, some very senior traders says (like Elder. Nison, Murphy) that a market has 3 phases, 1. we would go long, 2.we would go short, and 3.we will RUN (and definitely not WALK) away from market, i think this is the 3rd phases of the market, so believing their gospel i am running away from nse
at the same time, apart form some pending personal works i am devoting my time to another market and another instrument by using "MOSQUITO METHOD"   
i know, most of u, those who keep regular contact with me,even out of forum, already know 
as this method is new to me, so i am not announcing about it in forum right now, give me some time, let me become a good mosquito

who knows, there might be another thread, describing how to become a successful mosquito

but for that i need two things, 1. my own confidence in the new method and 2. permission from the person, who taught me "how to trade like a mosquito"
in the mean time, i am always here, i may not write on my own but i am visiting forum frequently, so if u have any thing to share/ask, just feel free as usual
|
|
| Back to top |
|
 |
singh.ravee
Yellow Belt

Joined: 12 Aug 2010
Posts: 678
|
Post: #2059  Posted: Sat Mar 05, 2011 10:23 am Post subject: Posted: Sat Mar 05, 2011 10:23 am Post subject: |
 |
|
Casper Bhai,
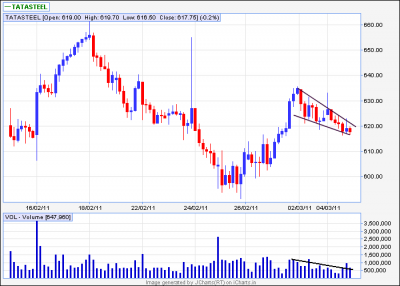
Is it a flag or falling wedge in tata steel 60min.
Thanks and Regards
Ravee
| Description: |
|
| Filesize: |
23.03 KB |
| Viewed: |
289 Time(s) |
|
|
|
| Back to top |
|
 |
casper
Green Belt

Joined: 02 Oct 2010
Posts: 1315
|
Post: #2060  Posted: Sat Mar 05, 2011 12:57 pm Post subject: Posted: Sat Mar 05, 2011 12:57 pm Post subject: |
 |
|
a flag, in general, should be a channel, not a cone, going by this theory, i can say it is a falling wedge and flag pole is not so distinct here too
but its not a problem as both the flag/wedge version as per the chart, is bullish one and we have strong support at lower level, monthly and weekly pivots are present there
so we can easily trade with the the break out of upper tl
|
|
| Back to top |
|
 |
Padkondu
White Belt

Joined: 23 Jan 2008
Posts: 120
|
Post: #2061  Posted: Sun Mar 06, 2011 12:29 pm Post subject: Posted: Sun Mar 06, 2011 12:29 pm Post subject: |
 |
|
Hi casper bhai!
same with me too, since i have no exposure to other markets, i am just focussing on my son, who is going to write his 10 th exams. hope i could enter market again by this week end?, people get wexed with the current petro problem and choose one direction. people do not want to stay with one problem longer time. let us see.
mean while could i have the privelege of having your e-mail id, through a private message.
regards
padkondu
Last edited by Padkondu on Thu Mar 10, 2011 9:25 am; edited 1 time in total |
|
| Back to top |
|
 |
singh.ravee
Yellow Belt

Joined: 12 Aug 2010
Posts: 678
|
Post: #2062  Posted: Mon Mar 07, 2011 9:42 am Post subject: Posted: Mon Mar 07, 2011 9:42 am Post subject: |
 |
|
Casper Hello,
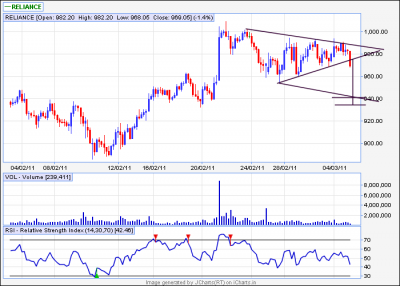
I am planning to go short with breakdown of ST in ril 60min.
Thanks and Regards
ravee
| Description: |
|
| Filesize: |
19.98 KB |
| Viewed: |
274 Time(s) |
|
|
|
| Back to top |
|
 |
casper
Green Belt

Joined: 02 Oct 2010
Posts: 1315
|
Post: #2063  Posted: Mon Mar 07, 2011 10:15 am Post subject: Posted: Mon Mar 07, 2011 10:15 am Post subject: |
 |
|
| singh.ravee wrote: | Casper Hello,
I am planning to go short with breakdown of ST in ril 60min.
Thanks and Regards
ravee |
during gaps, a gap fill up is more likely, i dont say dont short, but watch out before u take any step, i am posting u a contra view, and showing u, what i am planning to do, but plz plz plz, dont get biased, not by me,even not by u too, just open ur eyes and let ur brain decide
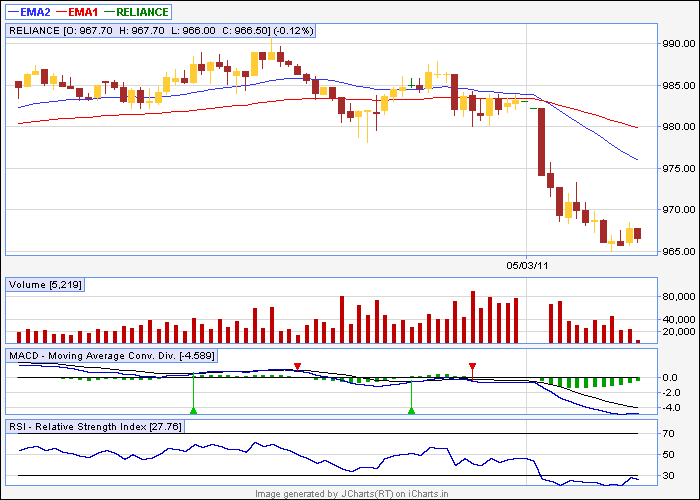
attached chart is 5 min chart of RIL, rsi is heavily OS and making a base here, price is following the rsi
which can go in any of the two ways
1. we can have a pull back
2. we can have a more fall
given the situation of rsi, a fall from here, with out a a lil bit pull back is of very remote chance, only in extremely bearish condition, this can happen
but due to this condition, a pull back, which will take rsi around 40-50, is likely, this pull back can give u 1rs upmove or may be 10 rs upmove, here price is not important,
important thing is, rsi should reach up to a position from where it can fall again
from our experience, we know, if rsi reach 40-50 band then it will be ready for further fall or rise
under this light, i will wait for a pull back and sell on rise here,
(this theory is a lil complex, i wish if i could call or chat with u to describe it, thats why, i never posted it in forum, bcoz i think, without face to face interaction, its hard to understand )
| Description: |
|
| Filesize: |
9.17 KB |
| Viewed: |
912 Time(s) |
|
|
|
| Back to top |
|
 |
singh.ravee
Yellow Belt

Joined: 12 Aug 2010
Posts: 678
|
Post: #2064  Posted: Mon Mar 07, 2011 10:56 am Post subject: Posted: Mon Mar 07, 2011 10:56 am Post subject: |
 |
|
casper,
thank u so much for your inputs. Infact, i treat it like this, try to enter around stomach(half of total height of candle) of the candle. Its inline with your explanation of 5min tf.
regards
ravee
|
|
| Back to top |
|
 |
casper
Green Belt

Joined: 02 Oct 2010
Posts: 1315
|
Post: #2065  Posted: Mon Mar 07, 2011 10:58 am Post subject: Posted: Mon Mar 07, 2011 10:58 am Post subject: |
 |
|
hi ravee and all
rsi in RIL reached 39 and now started falling, i am short here, but in partial, will short more, step by step if it goes up, for me crossing 975 is sl, and i will short my last part around this 975,
if price breached 975 by candle close, i will book loss
on the other hand, if price goes down and breaks recent low then i will short more, and trail my sl
TODAY IS VERY VOLATILE DAY, THOSE WHO CAN TOLERATE THE RISK SHOULD TRADE, OR ELSE JUST TAKE A PAPER TRADE, AT LEAST IT WILL GIVE U SOME EXP OF HANDLING THIS KINDS OF SITUATION
ONE MORE THING....... I AM FOLLOWING 5 MIN CHART AND MY MOTHER SET UP IS 30 MIN CHART FOR THIS TRADE
|
|
| Back to top |
|
 |
anand1234
Yellow Belt

Joined: 17 Jul 2010
Posts: 830
|
Post: #2066  Posted: Mon Mar 07, 2011 11:36 am Post subject: Posted: Mon Mar 07, 2011 11:36 am Post subject: |
 |
|
| casper wrote: | hi ravee and all
rsi in RIL reached 39 and now started falling, i am short here, but in partial, will short more, step by step if it goes up, for me crossing 975 is sl, and i will short my last part around this 975,
if price breached 975 by candle close, i will book loss
on the other hand, if price goes down and breaks recent low then i will short more, and trail my sl
TODAY IS VERY VOLATILE DAY, THOSE WHO CAN TOLERATE THE RISK SHOULD TRADE, OR ELSE JUST TAKE A PAPER TRADE, AT LEAST IT WILL GIVE U SOME EXP OF HANDLING THIS KINDS OF SITUATION
ONE MORE THING....... I AM FOLLOWING 5 MIN CHART AND MY MOTHER SET UP IS 30 MIN CHART FOR THIS TRADE |
hi....casper
well I hv also short ril around 967............with s/l 976.............but any tgt for to day on dwn side??.......pls comments on this
thanks
anand
|
|
| Back to top |
|
 |
casper
Green Belt

Joined: 02 Oct 2010
Posts: 1315
|
Post: #2067  Posted: Mon Mar 07, 2011 11:43 am Post subject: Posted: Mon Mar 07, 2011 11:43 am Post subject: |
 |
|
i hv shorted a lil more at 969 when spike up move came, and will try to cover it around 964-963, and will trail my sl with 34 ema in 5 min chart, its now around 971
if 34 ema is broken by an up move in 5 min chart i will close it
|
|
| Back to top |
|
 |
singh.ravee
Yellow Belt

Joined: 12 Aug 2010
Posts: 678
|
Post: #2068  Posted: Wed Mar 09, 2011 8:47 am Post subject: Posted: Wed Mar 09, 2011 8:47 am Post subject: |
 |
|
Casper Hello,
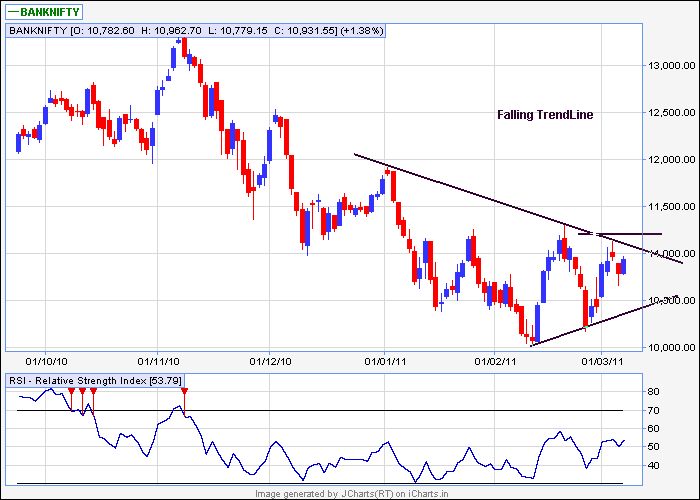
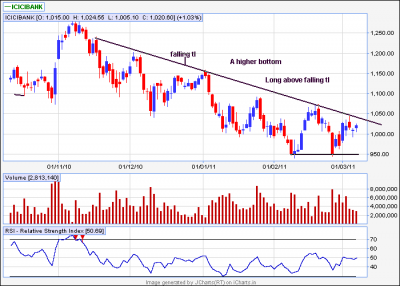
Almost similar pattern in bank nifty and icici bank. Long can be initiated above falling trend line.
I think close above trend line will reverse the downtrend in these two counters.
Your valuable comments please.
Thanks and Regards
ravee
| Description: |
|
| Filesize: |
11.63 KB |
| Viewed: |
698 Time(s) |
|
| Description: |
|
| Filesize: |
11.88 KB |
| Viewed: |
229 Time(s) |
|
|
|
| Back to top |
|
 |
casper
Green Belt

Joined: 02 Oct 2010
Posts: 1315
|
Post: #2069  Posted: Wed Mar 09, 2011 9:41 am Post subject: Posted: Wed Mar 09, 2011 9:41 am Post subject: |
 |
|
absolutely right
both the tls if broken, should give enough momentum upward, besides, shorter's sls will be hit, so buying will become more if these are broken convincingly
|
|
| Back to top |
|
 |
sumesh_sol
Brown Belt

Joined: 06 Jun 2010
Posts: 2344
|
Post: #2070  Posted: Wed Mar 09, 2011 10:55 am Post subject: Posted: Wed Mar 09, 2011 10:55 am Post subject: |
 |
|
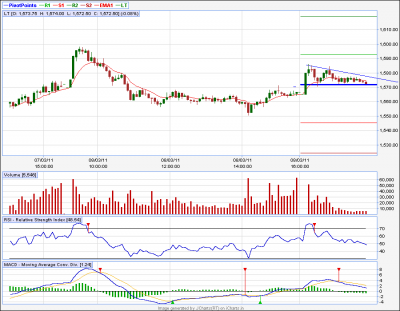
LT..5tf
below 1270.. 1260 is possible
| Description: |
|
| Filesize: |
17.84 KB |
| Viewed: |
217 Time(s) |
|
|
|
| Back to top |
|
 |
|
|
You cannot post new topics in this forum
You cannot reply to topics in this forum
You cannot edit your posts in this forum
You cannot delete your posts in this forum
You cannot vote in polls in this forum
You can attach files in this forum
You can download files in this forum
|
Powered by phpBB © 2001, 2005 phpBB Group
|
|
|

