| View previous topic :: View next topic |
| Author |
a layman's approach to break out and break down |
casper
Green Belt

Joined: 02 Oct 2010
Posts: 1315
|
Post: #2086  Posted: Wed Mar 09, 2011 1:14 pm Post subject: Posted: Wed Mar 09, 2011 1:14 pm Post subject: |
 |
|
| singh.ravee wrote: | Casper Bhai,
in this l&t eod chart in the area marked in rectangle, observe very high volume. does it reflect, what normally is referred as bottom fishing. Mean a big upmove is waiting.
Kindly clarify
thanks and regards
ravee |
need to really think if it fresh buying or not, i will check OI data for that and will update in forum and personally u too
just glancing at the chart i feel some body has covered shorts
we are falling here from 2100 levels gradually and after 6th january, we had a sort of h/s bd
so i guess (just guess) so many short was there, some body is covering the shorts
|
|
| Back to top |
|
 |
|
|
 |
as4manju
White Belt

Joined: 22 Mar 2007
Posts: 390
|
Post: #2087  Posted: Wed Mar 09, 2011 2:04 pm Post subject: Posted: Wed Mar 09, 2011 2:04 pm Post subject: |
 |
|
Wel ravi..
If u remeber before i went on vaccation i gave a list of stock and long term support where on can enter the stocks for investments and LT did feature in the list and the level that was given was also 1480 and this levels is the support zone in ur graph also so some know something that we dont know....
Even i also waiting this time for the dip to 1500 levels to buy the stock..
Regards
Manju
| casper wrote: | | singh.ravee wrote: | Casper Bhai,
in this l&t eod chart in the area marked in rectangle, observe very high volume. does it reflect, what normally is referred as bottom fishing. Mean a big upmove is waiting.
Kindly clarify
thanks and regards
ravee |
need to really think if it fresh buying or not, i will check OI data for that and will update in forum and personally u too
just glancing at the chart i feel some body has covered shorts
we are falling here from 2100 levels gradually and after 6th january, we had a sort of h/s bd
so i guess (just guess) so many short was there, some body is covering the shorts |
|
|
| Back to top |
|
 |
anand1234
Yellow Belt

Joined: 17 Jul 2010
Posts: 830
|
Post: #2088  Posted: Wed Mar 09, 2011 2:42 pm Post subject: Re: Nationalum Posted: Wed Mar 09, 2011 2:42 pm Post subject: Re: Nationalum |
 |
|
| sumesh_sol wrote: | Nationalum .. 5tf..
DT
Below 463 , we can see 458. Already nvk on top.. breaking this will confirm.. |
hi........sumesh
I sold national 462.7..............can I get 460 by to day............any s/l is req.??...........pls comments on this
thanks
anand
|
|
| Back to top |
|
 |
sumesh_sol
Brown Belt

Joined: 06 Jun 2010
Posts: 2344
|
Post: #2089  Posted: Wed Mar 09, 2011 2:44 pm Post subject: Re: Nationalum Posted: Wed Mar 09, 2011 2:44 pm Post subject: Re: Nationalum |
 |
|
| anand1234 wrote: | | sumesh_sol wrote: | Nationalum .. 5tf..
DT
Below 463 , we can see 458. Already nvk on top.. breaking this will confirm.. |
hi........sumesh
I sold national 462.7..............can I get 460 by to day............any s/l is req.??...........pls comments on this
thanks
anand |
Target 460/458 & Stoploss 465 both are possible today itself 
|
|
| Back to top |
|
 |
anand1234
Yellow Belt

Joined: 17 Jul 2010
Posts: 830
|
Post: #2090  Posted: Wed Mar 09, 2011 2:49 pm Post subject: Re: Nationalum Posted: Wed Mar 09, 2011 2:49 pm Post subject: Re: Nationalum |
 |
|
| sumesh_sol wrote: | | anand1234 wrote: | | sumesh_sol wrote: | Nationalum .. 5tf..
DT
Below 463 , we can see 458. Already nvk on top.. breaking this will confirm.. |
hi........sumesh
I sold national 462.7..............can I get 460 by to day............any s/l is req.??...........pls comments on this
thanks
anand |
hi.........sumesh
thanks for ur comments
thanks
anand
Target 460/458 & Stoploss 465 both are possible today itself  |
|
|
| Back to top |
|
 |
sumesh_sol
Brown Belt

Joined: 06 Jun 2010
Posts: 2344
|
Post: #2091  Posted: Wed Mar 09, 2011 3:24 pm Post subject: Re: Nationalum Posted: Wed Mar 09, 2011 3:24 pm Post subject: Re: Nationalum |
 |
|
| anand1234 wrote: | | sumesh_sol wrote: | | anand1234 wrote: | | sumesh_sol wrote: | Nationalum .. 5tf..
DT
Below 463 , we can see 458. Already nvk on top.. breaking this will confirm.. |
hi........sumesh
I sold national 462.7..............can I get 460 by to day............any s/l is req.??...........pls comments on this
thanks
anand |
Anand happy ??? 460/458 today itself.. 
But I feel sorry for those guys who are playing FnO in this.. as there is virtually no movement in FnO price w.r.t Spot...
hi.........sumesh
thanks for ur comments
thanks
anand
Target 460/458 & Stoploss 465 both are possible today itself  |
|
|
|
| Back to top |
|
 |
Ravi_S
Yellow Belt

Joined: 15 Jun 2009
Posts: 569
|
|
| Back to top |
|
 |
ridinghood
Yellow Belt

Joined: 16 Apr 2009
Posts: 724
|
Post: #2093  Posted: Wed Mar 09, 2011 10:18 pm Post subject: Posted: Wed Mar 09, 2011 10:18 pm Post subject: |
 |
|
Dear Ravi Sir
would u pl give target for nifty as per this pennant pattern?
regards
ridinghood
|
|
| Back to top |
|
 |
Ravi_S
Yellow Belt

Joined: 15 Jun 2009
Posts: 569
|
Post: #2094  Posted: Thu Mar 10, 2011 7:09 am Post subject: Posted: Thu Mar 10, 2011 7:09 am Post subject: |
 |
|
According to me it should retest the lows i.e around 5170 - 5200... Lets see how it takes shape...
| Ravi_S wrote: | NF is forming a massive pennant in daily  Any takers? Any takers? |
|
|
| Back to top |
|
 |
ridinghood
Yellow Belt

Joined: 16 Apr 2009
Posts: 724
|
Post: #2095  Posted: Thu Mar 10, 2011 9:27 am Post subject: Posted: Thu Mar 10, 2011 9:27 am Post subject: |
 |
|
thank u ravi sir for ur response
regs
ridinghood
|
|
| Back to top |
|
 |
sumesh_sol
Brown Belt

Joined: 06 Jun 2010
Posts: 2344
|
Post: #2096  Posted: Thu Mar 10, 2011 9:58 am Post subject: Ambujacem Posted: Thu Mar 10, 2011 9:58 am Post subject: Ambujacem |
 |
|
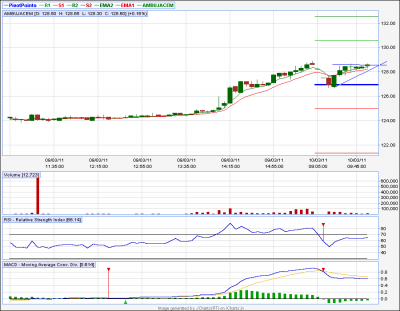
Ambujacem
************
AT on 5tf..
Above 129 BO.. tgt can be 130.5 +
| Description: |
|
| Filesize: |
16.12 KB |
| Viewed: |
210 Time(s) |

|
|
|
| Back to top |
|
 |
sumesh_sol
Brown Belt

Joined: 06 Jun 2010
Posts: 2344
|
Post: #2097  Posted: Thu Mar 10, 2011 10:48 am Post subject: Canbk Posted: Thu Mar 10, 2011 10:48 am Post subject: Canbk |
 |
|
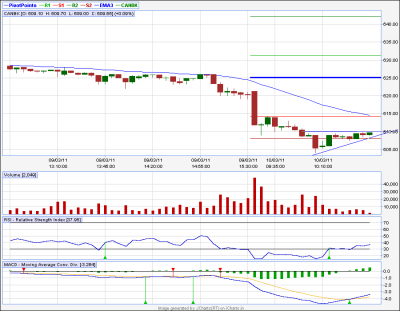
Canbk .. 5tf..
*************
AT..
canbk above 611.. can go 615 above that 625
Sl below 604
| Description: |
|
| Filesize: |
15.5 KB |
| Viewed: |
208 Time(s) |

|
|
|
| Back to top |
|
 |
sumesh_sol
Brown Belt

Joined: 06 Jun 2010
Posts: 2344
|
Post: #2098  Posted: Thu Mar 10, 2011 12:19 pm Post subject: Aban Posted: Thu Mar 10, 2011 12:19 pm Post subject: Aban |
 |
|
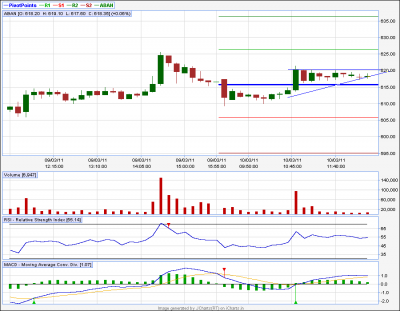
Aban ..10 tf
********
Aban if CLOSES on 10 tf above 620 , can reach 626 & 635
| Description: |
|
| Filesize: |
16.04 KB |
| Viewed: |
201 Time(s) |

|
|
|
| Back to top |
|
 |
sumesh_sol
Brown Belt

Joined: 06 Jun 2010
Posts: 2344
|
Post: #2099  Posted: Thu Mar 10, 2011 12:30 pm Post subject: SBIN..10TF Posted: Thu Mar 10, 2011 12:30 pm Post subject: SBIN..10TF |
 |
|
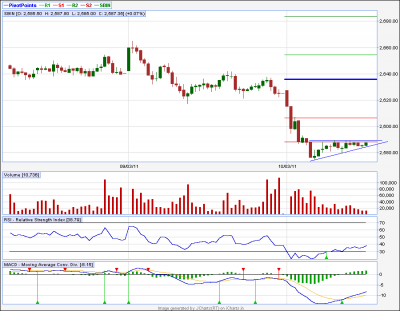
SBIN..10TF
**********
Another AT..
Above 2590 close, BO can take it to 2606 & 2620..
(I generally book 30% at first level and rest 70% at second)
| Description: |
|
| Filesize: |
13.75 KB |
| Viewed: |
200 Time(s) |

|
|
|
| Back to top |
|
 |
singh.ravee
Yellow Belt

Joined: 12 Aug 2010
Posts: 678
|
Post: #2100  Posted: Thu Mar 10, 2011 12:41 pm Post subject: Posted: Thu Mar 10, 2011 12:41 pm Post subject: |
 |
|
sumesh_sol
kindly check action of sbi in 60min before taking any decision
thanks and regards
ravee
|
|
| Back to top |
|
 |
|

