| View previous topic :: View next topic |
| Author |
a layman's approach to break out and break down |
sumesh_sol
Brown Belt

Joined: 06 Jun 2010
Posts: 2344
|
Post: #2101  Posted: Thu Mar 10, 2011 12:47 pm Post subject: Posted: Thu Mar 10, 2011 12:47 pm Post subject: |
 |
|
| singh.ravee wrote: | sumesh_sol
kindly check action of sbi in 60min before taking any decision
thanks and regards
ravee |
Thanks ravee for pointing out.. I think u r correct, With such huge red candle , even if it gets broken, there may not be a shart movement.. So, I will also avoid it now...
For that matter frinds, please avoid CANBK call also
|
|
| Back to top |
|
 |
|
|
 |
anand1234
Yellow Belt

Joined: 17 Jul 2010
Posts: 830
|
Post: #2102  Posted: Thu Mar 10, 2011 1:04 pm Post subject: Re: Aban Posted: Thu Mar 10, 2011 1:04 pm Post subject: Re: Aban |
 |
|
| sumesh_sol wrote: | Aban ..10 tf
********
Aban if CLOSES on 10 tf above 620 , can reach 626 & 635 |
HI...............SUMESH
CAN I BUY ABAN HERE @618??.............BCAUSE IT BREAKED 620 ALREADY??...............UR COMMENTS PLS
THANKS
ANAND
|
|
| Back to top |
|
 |
singh.ravee
Yellow Belt

Joined: 12 Aug 2010
Posts: 678
|
Post: #2103  Posted: Thu Mar 10, 2011 1:12 pm Post subject: Posted: Thu Mar 10, 2011 1:12 pm Post subject: |
 |
|
Hi,
there is bearish divergence in 60min aban. kindly take that into account
thanks and regards
ravee
|
|
| Back to top |
|
 |
anand1234
Yellow Belt

Joined: 17 Jul 2010
Posts: 830
|
Post: #2104  Posted: Thu Mar 10, 2011 1:18 pm Post subject: Posted: Thu Mar 10, 2011 1:18 pm Post subject: |
 |
|
| singh.ravee wrote: | Hi,
there is bearish divergence in 60min aban. kindly take that into account
thanks and regards
ravee |
hi...........ravee
thanks for ur comments
thanks
anand
|
|
| Back to top |
|
 |
singh.ravee
Yellow Belt

Joined: 12 Aug 2010
Posts: 678
|
Post: #2105  Posted: Fri Mar 11, 2011 11:41 am Post subject: Posted: Fri Mar 11, 2011 11:41 am Post subject: |
 |
|
Casper hello,
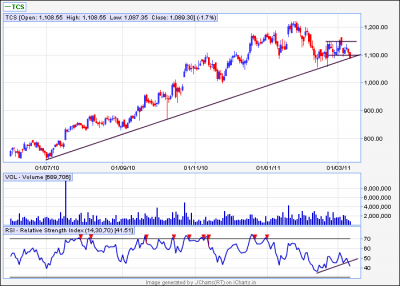
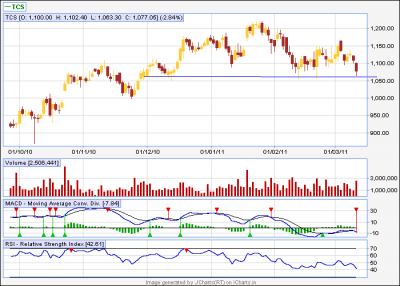
TCS eod is negotiating with long term tl. Will it bounce or break it? Lets keep an eye.
Thanks and Regards
ravee
| Description: |
|
| Filesize: |
20.49 KB |
| Viewed: |
230 Time(s) |
|
|
|
| Back to top |
|
 |
singh.ravee
Yellow Belt

Joined: 12 Aug 2010
Posts: 678
|
Post: #2106  Posted: Sat Mar 12, 2011 8:57 am Post subject: Posted: Sat Mar 12, 2011 8:57 am Post subject: |
 |
|
As you all are aware that earthquake and tsunami has caused huge destruction in japan. It killed hundreds and left many homeless.
I pray that the departed souls may rest in peace and pray to Almighty God to provide strength to the effected people.
Thanks and Regards
Ravee
|
|
| Back to top |
|
 |
singh.ravee
Yellow Belt

Joined: 12 Aug 2010
Posts: 678
|
Post: #2107  Posted: Sat Mar 12, 2011 10:36 am Post subject: Posted: Sat Mar 12, 2011 10:36 am Post subject: |
 |
|
Casper Bhai,
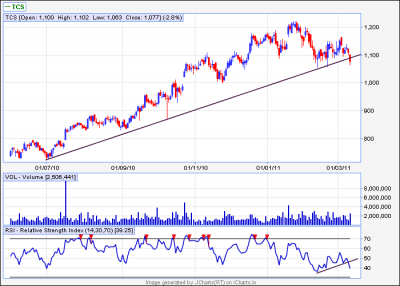
Can we consider it as a high vol breakdown from long term support. Or shall i wait for more signals
Thanks and Regards
ravee
| Description: |
|
| Filesize: |
20.35 KB |
| Viewed: |
239 Time(s) |
|
|
|
| Back to top |
|
 |
singh.ravee
Yellow Belt

Joined: 12 Aug 2010
Posts: 678
|
Post: #2108  Posted: Sat Mar 12, 2011 4:30 pm Post subject: Posted: Sat Mar 12, 2011 4:30 pm Post subject: |
 |
|
Casper Hello,
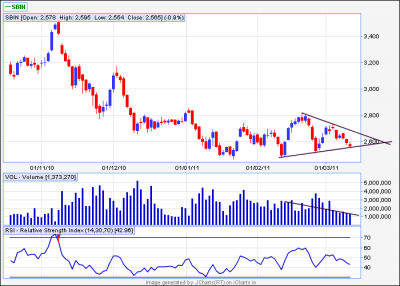
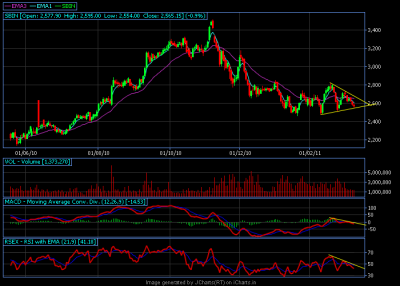
Is it a ST in SBI EOD. How to interpret, the spikes in the volumes during the triangle formation. Breakout is still awaited.
Thanks and Regards
ravee
P.S.: the width of ST is 300pts approx. If it is a true ST then its direction of breakout should tell a lot about the movement of market per se.
| Description: |
|
| Filesize: |
17.11 KB |
| Viewed: |
215 Time(s) |
|
|
|
| Back to top |
|
 |
nsinojia
Yellow Belt

Joined: 21 Dec 2009
Posts: 624
|
|
| Back to top |
|
 |
singh.ravee
Yellow Belt

Joined: 12 Aug 2010
Posts: 678
|
Post: #2110  Posted: Sat Mar 12, 2011 5:04 pm Post subject: Re: tringle break out isit? Posted: Sat Mar 12, 2011 5:04 pm Post subject: Re: tringle break out isit? |
 |
|
| nsinojia wrote: |  i m not expert to observe tringle breakout-down ., just tried to explain how volume behaves when any tringle break-out-down happens i m not expert to observe tringle breakout-down ., just tried to explain how volume behaves when any tringle break-out-down happens |
nitin sir,
thank u so much.
regards
ravee
|
|
| Back to top |
|
 |
singh.ravee
Yellow Belt

Joined: 12 Aug 2010
Posts: 678
|
Post: #2111  Posted: Sat Mar 12, 2011 5:44 pm Post subject: Posted: Sat Mar 12, 2011 5:44 pm Post subject: |
 |
|
Casper,
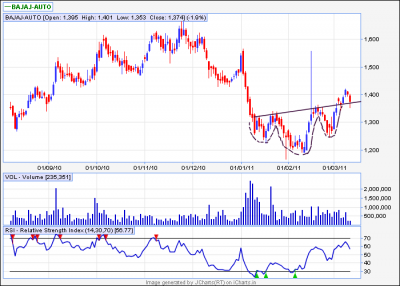
Is it inverted h&s in bajaj auto.
Thanks and regards
ravee
| Description: |
|
| Filesize: |
20.05 KB |
| Viewed: |
195 Time(s) |
|
|
|
| Back to top |
|
 |
ronypan
White Belt

Joined: 07 Aug 2010
Posts: 197
|
Post: #2112  Posted: Sat Mar 12, 2011 5:48 pm Post subject: Andhrabank Short Posted: Sat Mar 12, 2011 5:48 pm Post subject: Andhrabank Short |
 |
|
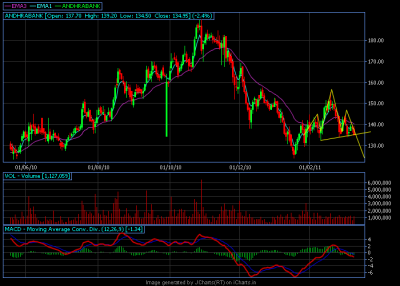
Andhrabank Short..
Pattern is being form once it crashed below 134, it can touch to 110 and 105.
| Description: |
|
| Filesize: |
26.69 KB |
| Viewed: |
212 Time(s) |
|
|
|
| Back to top |
|
 |
ronypan
White Belt

Joined: 07 Aug 2010
Posts: 197
|
Post: #2113  Posted: Sat Mar 12, 2011 5:57 pm Post subject: SBIN Posted: Sat Mar 12, 2011 5:57 pm Post subject: SBIN |
 |
|
SBIN once breaks the trend line, It will collapsed to downside..
| Description: |
|
| Filesize: |
28.43 KB |
| Viewed: |
213 Time(s) |
|
|
|
| Back to top |
|
 |
casper
Green Belt

Joined: 02 Oct 2010
Posts: 1315
|
Post: #2114  Posted: Sat Mar 12, 2011 6:39 pm Post subject: Posted: Sat Mar 12, 2011 6:39 pm Post subject: |
 |
|
| singh.ravee wrote: | Casper Bhai,
Can we consider it as a high vol breakdown from long term support. Or shall i wait for more signals
Thanks and Regards
ravee |
hii paajii
i am here with another version of tcs chart-eod
see it and u will know why not so significant volume is there, hope if the pattern i am posting, breaks down properly, we will have a tremendous volume here
its one of the most active stocks, here any significant move deserves heavy volume
| Description: |
|
| Filesize: |
12.1 KB |
| Viewed: |
207 Time(s) |
|
|
|
| Back to top |
|
 |
casper
Green Belt

Joined: 02 Oct 2010
Posts: 1315
|
Post: #2115  Posted: Sat Mar 12, 2011 6:49 pm Post subject: Posted: Sat Mar 12, 2011 6:49 pm Post subject: |
 |
|
| singh.ravee wrote: | Casper Hello,
Is it a ST in SBI EOD. How to interpret, the spikes in the volumes during the triangle formation. Breakout is still awaited.
Thanks and Regards
ravee
P.S.: the width of ST is 300pts approx. If it is a true ST then its direction of breakout should tell a lot about the movement of market per se. |
its an ST of course and its move will simply hold nifty by its neck and make nifty to move along with it, its one of the heavy weights
but seeing the eod adx position, i will expect another cycle of consolidation, means, i will hope, if everything goes normal, it may go up to 2635 level
if some body is too disciplined and too risky, he should buy here with the sl of lower tl, by closing and target of 2635
(i am not advising to buy, u just can take a paper trade on it like this,im not advising bcoz, it shows some bullish symptoms as per my latest adx study, as study is not finished yet so i am not in a position to ask any body buy it)
|
|
| Back to top |
|
 |
|

