|
|
| View previous topic :: View next topic |
| Author |
a layman's approach to break out and break down |
casper
Green Belt

Joined: 02 Oct 2010
Posts: 1315
|
Post: #2116  Posted: Sat Mar 12, 2011 6:59 pm Post subject: Re: tringle break out isit? Posted: Sat Mar 12, 2011 6:59 pm Post subject: Re: tringle break out isit? |
 |
|
| nsinojia wrote: | | singh.ravee wrote: | Casper Hello,
Is it a ST in SBI EOD. How to interpret, the spikes in the volumes during the triangle formation. Breakout is still awaited.
Thanks and Regards
ravee
P.S.: the width of ST is 300pts approx. If it is a true ST then its direction of breakout should tell a lot about the movement of market per se. |
 i m not expert to observe tringle breakout-down ., just tried to explain how volume behaves when any tringle break-out-down happens i m not expert to observe tringle breakout-down ., just tried to explain how volume behaves when any tringle break-out-down happens |
hii nitin sir, welcome to our thread!!!
nowadays not getting any free time to check SB and missing ur updates,TFTD and moreover hilarious jokes, apart from contacting admin directly about some problems, u r my only reason to check SB
  
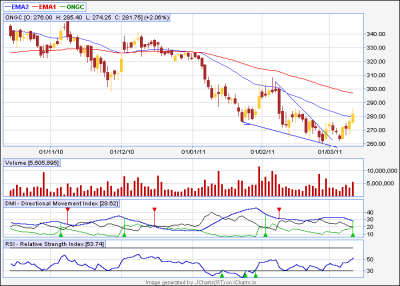
ongc chart, as per my drawing, seems like a falling wedge, it was not a triangle proper, and as per the patterns proper way, it gave a nice bo
i am attaching my chart here
ps: due to some problem in my pc, i cant see black charts, so i hv drawn it, plz check and tell me if my wedge is the same pattern which u indicated as triangle?
| Description: |
|
| Filesize: |
13.87 KB |
| Viewed: |
250 Time(s) |
|
|
|
| Back to top |
|
 |
|
|  |
casper
Green Belt

Joined: 02 Oct 2010
Posts: 1315
|
Post: #2117  Posted: Sat Mar 12, 2011 7:03 pm Post subject: Posted: Sat Mar 12, 2011 7:03 pm Post subject: |
 |
|
| singh.ravee wrote: | Casper,
Is it inverted h&s in bajaj auto.
Thanks and regards
ravee |
in case of h/s or inv h/s, retesting the neck line is a common phenomenon
during this procedure, some stocks hold neckline and goes along with the proper way of bo/bd and in some cases, it breaks neckline and thus the pattern at least in theory, becomes invalid
here, we have broken the neckline, so classically our inv h/s is gone, but we can always buy it if it ever crosses neckline with some increased volume
|
|
| Back to top |
|
 |
casper
Green Belt

Joined: 02 Oct 2010
Posts: 1315
|
Post: #2118  Posted: Sat Mar 12, 2011 7:09 pm Post subject: Re: Andhrabank Short Posted: Sat Mar 12, 2011 7:09 pm Post subject: Re: Andhrabank Short |
 |
|
| ronypan wrote: | Andhrabank Short..
Pattern is being form once it crashed below 134, it can touch to 110 and 105. |
nice finding brother, plz keep it up  
just an update, if we are short here with multiple fut lots, then we can cover some of our loads around 125 level too
|
|
| Back to top |
|
 |
casper
Green Belt

Joined: 02 Oct 2010
Posts: 1315
|
Post: #2119  Posted: Sat Mar 12, 2011 7:14 pm Post subject: Posted: Sat Mar 12, 2011 7:14 pm Post subject: |
 |
|
ravee paaji, ronypan, nitin sir
our thread is rocking 
after a lot of time, we are getting quality question/updates about t.a. not merely "call posting and calls searching"
the number of posts u made, just remind me the early days, when we tried to focus on education 1st and calls 2nd
i am so happy to see that in the forum, there is still some guys around, who tries to learn, not merely "earn today and forget tomorrow"
money and wining trade is a factor, but if we need to go a long way, then we must build our ground first
plz keep it up
|
|
| Back to top |
|
 |
casper
Green Belt

Joined: 02 Oct 2010
Posts: 1315
|
Post: #2120  Posted: Sat Mar 12, 2011 7:23 pm Post subject: Posted: Sat Mar 12, 2011 7:23 pm Post subject: |
 |
|
| singh.ravee wrote: | As you all are aware that earthquake and tsunami has caused huge destruction in japan. It killed hundreds and left many homeless.
I pray that the departed souls may rest in peace and pray to Almighty God to provide strength to the effected people.
Thanks and Regards
Ravee |
at last, i am updating this post, so that whomever comes here, sees this 1st, i hereby convey my condolence and prayer to those peoples who just have seen the "rudra-rup" of LORD SHIVA the "NATARAJ" in forms of earthquake and tsunami and now, possible nuclear disaster too
may the HOLY MOTHER helps them
|
|
| Back to top |
|
 |
technocalls
White Belt

Joined: 27 Aug 2010
Posts: 34
|
Post: #2121  Posted: Sun Mar 13, 2011 1:04 am Post subject: Posted: Sun Mar 13, 2011 1:04 am Post subject: |
 |
|
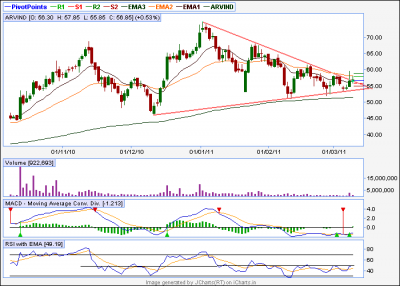
arvind = looking for a break . . . . .RSI facing some resistance arnd 44
| Description: |
|
| Filesize: |
22.58 KB |
| Viewed: |
263 Time(s) |
|
|
|
| Back to top |
|
 |
technocalls
White Belt

Joined: 27 Aug 2010
Posts: 34
|
Post: #2122  Posted: Sun Mar 13, 2011 1:23 am Post subject: Posted: Sun Mar 13, 2011 1:23 am Post subject: |
 |
|
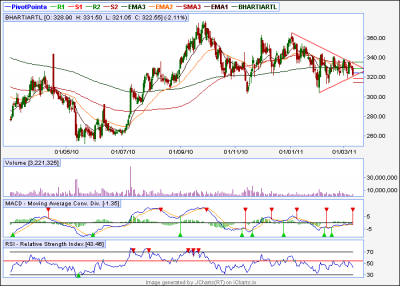
bharti airtel = same story like arvind looking for a break. . . .RSI facing resistance arnd 44
| Description: |
|
| Filesize: |
16.67 KB |
| Viewed: |
220 Time(s) |
|
|
|
| Back to top |
|
 |
casper
Green Belt

Joined: 02 Oct 2010
Posts: 1315
|
Post: #2123  Posted: Sun Mar 13, 2011 7:58 am Post subject: Posted: Sun Mar 13, 2011 7:58 am Post subject: |
 |
|
hey technocalls!!!!
what made u think about rsi facing resistance? r u spying on me or our team which is working on "indicator support/resi and indicator break out"???? 
plz dont mnd, just kidding!!!! (u know naa, i always like to joke)
according to our belief, u r going in right directions, here we are working in a team and i assume, u r doing it all alone, hat's off to u
  
wish u more success
  
|
|
| Back to top |
|
 |
singh.ravee
Yellow Belt

Joined: 12 Aug 2010
Posts: 678
|
Post: #2124  Posted: Sun Mar 13, 2011 9:43 am Post subject: Posted: Sun Mar 13, 2011 9:43 am Post subject: |
 |
|
Casper Hello,
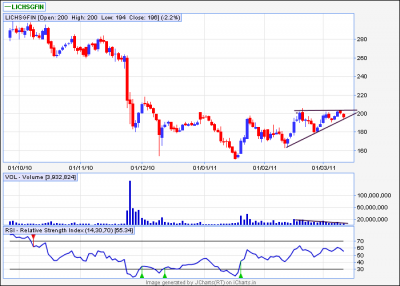
an AT in lic hsg fin eod.
thanks and regards
ravee
| Description: |
|
| Filesize: |
16.19 KB |
| Viewed: |
199 Time(s) |
|
|
|
| Back to top |
|
 |
singh.ravee
Yellow Belt

Joined: 12 Aug 2010
Posts: 678
|
Post: #2125  Posted: Sun Mar 13, 2011 10:16 am Post subject: Posted: Sun Mar 13, 2011 10:16 am Post subject: |
 |
|
Casper bhai,
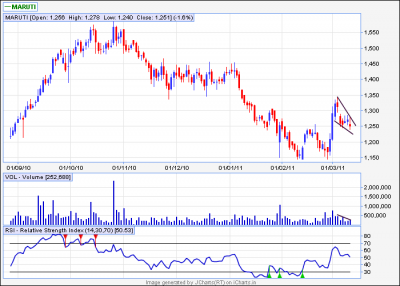
another bullish pattern in maruti eod. A falling wedge with falling volumes.
most of the charts that i have seen has bullish patterns. Dont know, how market is going to react to japan news. If these bullish patterns succeed then we can see a good upmove. I feel if market fails, its going to be a big party for bears.
thanks and regards
ravee
| Description: |
|
| Filesize: |
17.78 KB |
| Viewed: |
229 Time(s) |
|
|
|
| Back to top |
|
 |
casper
Green Belt

Joined: 02 Oct 2010
Posts: 1315
|
Post: #2126  Posted: Sun Mar 13, 2011 7:22 pm Post subject: Posted: Sun Mar 13, 2011 7:22 pm Post subject: |
 |
|
| singh.ravee wrote: | Casper Hello,
an AT in lic hsg fin eod.
thanks and regards
ravee |
sumesh bhai also found this 
yes its an at, but the highs are not equal, slightly higher, i hope it will give break out
(if the highs were a lil more higher, some thing like distinguishable, i wud try to see it as an wedge!)
|
|
| Back to top |
|
 |
casper
Green Belt

Joined: 02 Oct 2010
Posts: 1315
|
Post: #2127  Posted: Sun Mar 13, 2011 7:23 pm Post subject: Posted: Sun Mar 13, 2011 7:23 pm Post subject: |
 |
|
| singh.ravee wrote: | Casper bhai,
another bullish pattern in maruti eod. A falling wedge with falling volumes.
most of the charts that i have seen has bullish patterns. Dont know, how market is going to react to japan news. If these bullish patterns succeed then we can see a good upmove. I feel if market fails, its going to be a big party for bears.
thanks and regards
ravee |
yes correct, who knows tomorrow may become trend decider
|
|
| Back to top |
|
 |
casper
Green Belt

Joined: 02 Oct 2010
Posts: 1315
|
Post: #2128  Posted: Sun Mar 13, 2011 7:55 pm Post subject: Posted: Sun Mar 13, 2011 7:55 pm Post subject: |
 |
|
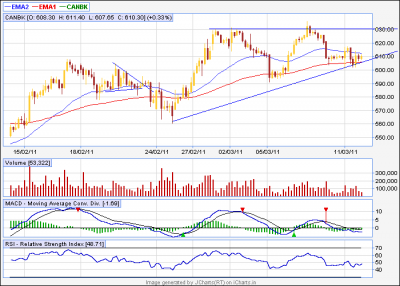
a few charts....
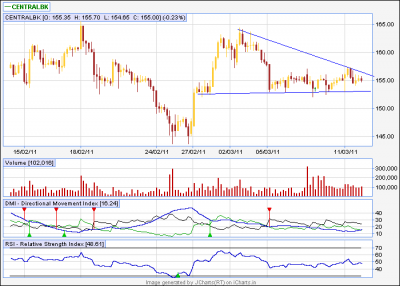
1.central bk
**********
a dt in formation, if it breaks below 152, we can sell for a target of 145, 140
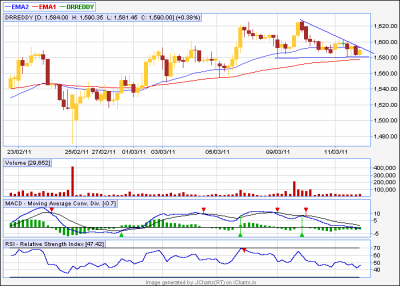
2.drreddy
**********
dt in formation, break out will not do here, lower tl is supported by 89 ema, so we can sell only below 89 ema,
target i think monthly pivot at 1555
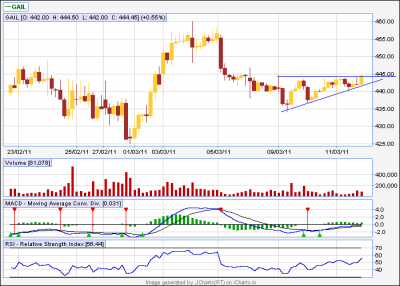
3. gail
*******
at in formation, we can buy above 447 and target 454,460
4.canbk
********
assuming that this good old stock will form an ascending triangle, we can buy it above 34 ema (blue line) and target the upper tl at 630 for now
how we r going to do it
********************
1. except canbk, all other calls needs specific level breaks so we wont jump before actual breaking
2.all charts are 60 min tf so we need to watch them in 60 min for initial breaks
3. once such a break comes, we will switch over to 15 min or 10 min tf to see for entry points
4. a candle close in 10/15 min chart above/below bo/bd level will serve as entry signal
5. a 15/10 min candle close below/above bo/bd level will serve as initial sl
6. after that, we are going to trail the sl as per our risk management techniques
ps: sumesh bhai, plz post ur findings too (which u already found)
| Description: |
|
| Filesize: |
13.1 KB |
| Viewed: |
221 Time(s) |
|
| Description: |
|
| Filesize: |
13.28 KB |
| Viewed: |
205 Time(s) |
|
| Description: |
|
| Filesize: |
12.12 KB |
| Viewed: |
208 Time(s) |
|
| Description: |
|
| Filesize: |
15.03 KB |
| Viewed: |
234 Time(s) |
|
|
|
| Back to top |
|
 |
vishytns
White Belt

Joined: 26 Nov 2009
Posts: 206
|
Post: #2129  Posted: Sun Mar 13, 2011 8:21 pm Post subject: Posted: Sun Mar 13, 2011 8:21 pm Post subject: |
 |
|
Casper,
Many of us were missing your calls these days. It is like "Moon comming out of clouds". I forgot the hindi proverb, otherwise i would have quoted that for sure. I am sure you will not go behind the clouds again. Expecting you give daily calls from monday onwards. I will trade some of your calls tommorow.
Thanks and regards
Vishy
|
|
| Back to top |
|
 |
casper
Green Belt

Joined: 02 Oct 2010
Posts: 1315
|
Post: #2130  Posted: Sun Mar 13, 2011 8:48 pm Post subject: Posted: Sun Mar 13, 2011 8:48 pm Post subject: |
 |
|
| vishytns wrote: | Casper,
Many of us were missing your calls these days. It is like "Moon comming out of clouds". I forgot the hindi proverb, otherwise i would have quoted that for sure. I am sure you will not go behind the clouds again. Expecting you give daily calls from monday onwards. I will trade some of your calls tommorow.
Thanks and regards
Vishy |
we (u, me, any body else) provide calls or post our findings as potential trading opportunities with a few targets
1. to see our method is working or not
2. to attract attention of fellow traders so that they can provide their important inputs in order to refine our systems
3.to increase profit potential at the same time, minimizing the loss by a coordinated interaction of all the forum members
now, what i feel, any thing and every thing can work as long as we can make profit form that, thats the main thing in the market, though i personally feel proud (im a human being too) if u come in open forum and welcome me while describing that u have waited for my calls
still i wud say, during my self-exile, sumesh bhai, ravee paaji and others also did great job here and i dare say, my absence was really not felt in the forum, though i updated all the queries which were directly addressed to me whenever it was possible for me
|
|
| Back to top |
|
 |
|
|
You cannot post new topics in this forum
You cannot reply to topics in this forum
You cannot edit your posts in this forum
You cannot delete your posts in this forum
You cannot vote in polls in this forum
You can attach files in this forum
You can download files in this forum
|
Powered by phpBB © 2001, 2005 phpBB Group
|
|
|

