|
|
| View previous topic :: View next topic |
| Author |
a layman's approach to break out and break down |
girishhu1
White Belt

Joined: 17 Aug 2009
Posts: 316
|
Post: #2176  Posted: Thu Mar 17, 2011 8:07 am Post subject: Posted: Thu Mar 17, 2011 8:07 am Post subject: |
 |
|
hi Casperji,
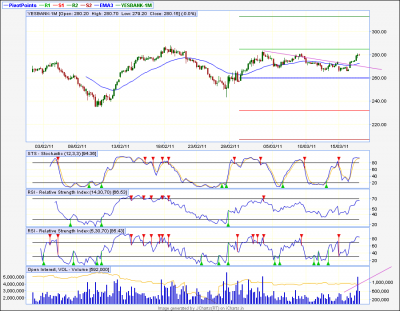
enclosing 60m chart of yes bank. i can see hns pattern with a target of rs 17 from bo level of 273. can you confirm and if yes, give me the intraday plan to enter as i feel stock may come back to neckline before reaching target.
regards,
girish
| Description: |
|
| Filesize: |
50.77 KB |
| Viewed: |
214 Time(s) |
|
|
|
| Back to top |
|
 |
|
|  |
casper
Green Belt

Joined: 02 Oct 2010
Posts: 1315
|
Post: #2177  Posted: Thu Mar 17, 2011 8:41 am Post subject: Posted: Thu Mar 17, 2011 8:41 am Post subject: |
 |
|
| girishhu1 wrote: | hi Casperji,
enclosing 60m chart of yes bank. i can see hns pattern with a target of rs 17 from bo level of 273. can you confirm and if yes, give me the intraday plan to enter as i feel stock may come back to neckline before reaching target.
regards,
girish |
this pattern has not formed in cash chart only available in fut charts, and its not h/s, its a sort of inv h/s but not proper one as the left shoulder is higher than head
now, going by the tl, if it comes in a back thrust towards tl then we can buy at the tl as close as possible and keep sl of a candle close below the tl
by da way, today i think rbi policy will be announced so banks are not very good bet for today as it will be fundamental driven case here
(got my mail???if yes, plz confirm,  ) )
|
|
| Back to top |
|
 |
sumesh_sol
Brown Belt

Joined: 06 Jun 2010
Posts: 2344
|
|
| Back to top |
|
 |
sumesh_sol
Brown Belt

Joined: 06 Jun 2010
Posts: 2344
|
Post: #2179  Posted: Thu Mar 17, 2011 11:22 am Post subject: Posted: Thu Mar 17, 2011 11:22 am Post subject: |
 |
|
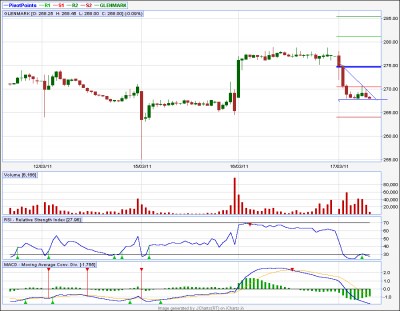
GLENMARK 15tf
**************
Short below 267.4 can be taken for a small tgt of 264/262
| Description: |
|
| Filesize: |
15.26 KB |
| Viewed: |
210 Time(s) |
|
|
|
| Back to top |
|
 |
deepakms
White Belt

Joined: 13 Aug 2009
Posts: 194
|
Post: #2180  Posted: Thu Mar 17, 2011 1:49 pm Post subject: Posted: Thu Mar 17, 2011 1:49 pm Post subject: |
 |
|
Sumesh/Casper,
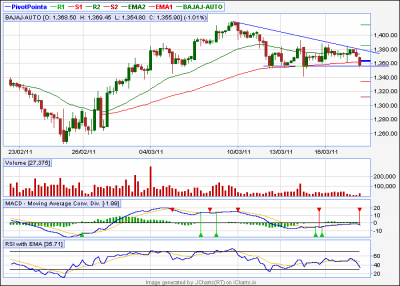
HDFC on 60 min Tf......u views and probable targets .
Thnx/Rgds
Deepak
| Description: |
|
| Filesize: |
13.93 KB |
| Viewed: |
203 Time(s) |
|
|
|
| Back to top |
|
 |
deepakms
White Belt

Joined: 13 Aug 2009
Posts: 194
|
Post: #2181  Posted: Thu Mar 17, 2011 1:50 pm Post subject: Posted: Thu Mar 17, 2011 1:50 pm Post subject: |
 |
|
Sorry the previous post was Baja-Auto.... 
|
|
| Back to top |
|
 |
sumesh_sol
Brown Belt

Joined: 06 Jun 2010
Posts: 2344
|
|
| Back to top |
|
 |
deepakms
White Belt

Joined: 13 Aug 2009
Posts: 194
|
Post: #2183  Posted: Thu Mar 17, 2011 2:30 pm Post subject: Posted: Thu Mar 17, 2011 2:30 pm Post subject: |
 |
|
Sumesh,
Thnx for the update,if its a H&S pattern and closing below means a (Break Down ) right.So possibly it could fall from here......pls correct me ! if its wrong. U have mentioned BO so ,is it an upmove or down move....?
Thnx/Rgds
Deepak
|
|
| Back to top |
|
 |
sumesh_sol
Brown Belt

Joined: 06 Jun 2010
Posts: 2344
|
Post: #2184  Posted: Thu Mar 17, 2011 2:33 pm Post subject: Posted: Thu Mar 17, 2011 2:33 pm Post subject: |
 |
|
| deepakms wrote: | Sumesh,
Thnx for the update,if its a H&S pattern and closing below means a (Break Down ) right.So possibly it could fall from here......pls correct me ! if its wrong. U have mentioned BO so ,is it an upmove or down move....?
Thnx/Rgds
Deepak |
Yes I was actually referring to breakout from the range (in this case it is actually a breakdown.) But this should be convincing breakdown, a small candle close below neckline without any significant volume will not serve the purpose...
|
|
| Back to top |
|
 |
girishhu1
White Belt

Joined: 17 Aug 2009
Posts: 316
|
Post: #2185  Posted: Fri Mar 18, 2011 8:13 am Post subject: Posted: Fri Mar 18, 2011 8:13 am Post subject: |
 |
|
hi all,
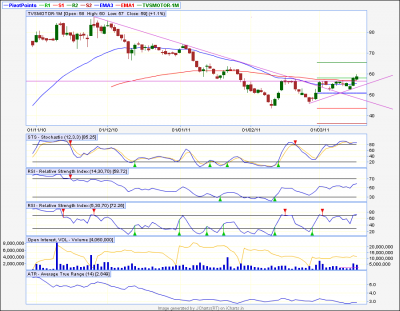
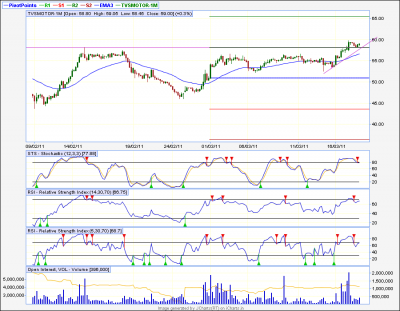
seen chart of bajaj auto. here is eod and 60m chart of tvsmotors. appears to have broken out of AT. Experts pl comment
regards,
girish
| Description: |
|
| Filesize: |
49.4 KB |
| Viewed: |
232 Time(s) |
|
| Description: |
|
| Filesize: |
44.52 KB |
| Viewed: |
204 Time(s) |
|
|
|
| Back to top |
|
 |
casper
Green Belt

Joined: 02 Oct 2010
Posts: 1315
|
Post: #2186  Posted: Fri Mar 18, 2011 9:01 am Post subject: Posted: Fri Mar 18, 2011 9:01 am Post subject: |
 |
|
| girishhu1 wrote: | hi all,
seen chart of bajaj auto. here is eod and 60m chart of tvsmotors. appears to have broken out of AT. Experts pl comment
regards,
girish |
hii girish bhaiya
its At ofcourse , now i am sharing my observation of pattern on which i am lately working,
in the simplest term, i believe, the success of pattern grossly depends upon rsi or any other momentum indicator reading
if i try to put it very simply, then i would say, price and rsi must confirm each other in order to give us desired result
now plz check the AT in eod, price made AT and rsi too made an AT, this gives us some of best moves (if no fundamental development arises)
as far the 60 min chart, our rsi is OB, means here we can expect some pull back and as long as bo level is respected, we can always buy on that pull back, with a sl of bo level
when i started interpreting bo/bd, i gave more importance to trend identification, so i used macd on a greater extent, as time is going on, my focus is coming mostly on the momentum,i.e. rsi part, a successful interpretation of rsi can tell us a lot of story, but the most basic thing among these stories are, if price and rsi is following each other, then the direction will be fixed, without any whipsaw,and we will get better movements
|
|
| Back to top |
|
 |
newinvestor
White Belt

Joined: 16 Feb 2010
Posts: 120
|
Post: #2187  Posted: Fri Mar 18, 2011 9:46 am Post subject: Posted: Fri Mar 18, 2011 9:46 am Post subject: |
 |
|
| casper wrote: | | girishhu1 wrote: | hi all,
seen chart of bajaj auto. here is eod and 60m chart of tvsmotors. appears to have broken out of AT. Experts pl comment
regards,
girish |
hii girish bhaiya
its At ofcourse , now i am sharing my observation of pattern on which i am lately working,
in the simplest term, i believe, the success of pattern grossly depends upon rsi or any other momentum indicator reading
if i try to put it very simply, then i would say, price and rsi must confirm each other in order to give us desired result
now plz check the AT in eod, price made AT and rsi too made an AT, this gives us some of best moves (if no fundamental development arises)
as far the 60 min chart, our rsi is OB, means here we can expect some pull back and as long as bo level is respected, we can always buy on that pull back, with a sl of bo level
when i started interpreting bo/bd, i gave more importance to trend identification, so i used macd on a greater extent, as time is going on, my focus is coming mostly on the momentum,i.e. rsi part, a successful interpretation of rsi can tell us a lot of story, but the most basic thing among these stories are, if price and rsi is following each other, then the direction will be fixed, without any whipsaw,and we will get better movements |
Casper, hope to have you back on the Forum as active as before.
Last few days, I was going throuh your study ( of a few months ago), where you laid emphasis on MACD and RSI to back the price , for a succesful BO/BD.
I have just started trying to understand ADX. Will ADX be a good tool also to use to confirm BO/BD?
|
|
| Back to top |
|
 |
casper
Green Belt

Joined: 02 Oct 2010
Posts: 1315
|
Post: #2188  Posted: Fri Mar 18, 2011 10:46 am Post subject: Posted: Fri Mar 18, 2011 10:46 am Post subject: |
 |
|
hii newinvestor!!!
after a long time,
yes adx will be very good tool to interpret bo/bd
i am currently working on that mostly, i am putting down the basic rules which i am testing
1.adx above 45-50=strong trend and mature one (it will either reverse or become choppy)
2.adx below 20= budding stage (meaning if u r long term player. start gathering goodies now, long trem player means, suppose u will buy 100qty and hold at least the total day but u r using 5tf instead of 60tf, so in comparison to a 5tf player, u r likely to hold longer, so u r, in my word, a long term player, i dont mean it for investors only, now out of 100 qty, start buying, say 20 at a time and average 5 times )
3.adx between 25-40= its ur time to take profit slowly as adx goes up
+di/-di above 40 means trend is over bought/over sold respectively, or going to be ob/os shortly
and a few more things also
in bo/bd, adx can replace macd, now if we use rsi with adx we can get excellent results
to all
i have sent a link to all those who have personal contact with me, out of forum, but those who can not contact me out of forum, plz download a free version of "METATRADER4" from any forex broker for free and start practicing paper trading with that demo a/c
i can not put those links, just google it and download and start paper trading.
apply what u know in forex/comm/internatioanl stocks, it will give u sound practice and makeu a formidable trader, if any help is needed, dont hesitate to knock me
|
|
| Back to top |
|
 |
anand1234
Yellow Belt

Joined: 17 Jul 2010
Posts: 830
|
Post: #2189  Posted: Fri Mar 18, 2011 10:52 am Post subject: Posted: Fri Mar 18, 2011 10:52 am Post subject: |
 |
|
| casper wrote: | its not a call for trading, i am running here and there, haphazardly as i am too busy now, but if any of u care, just watch bhartiship and ekc for 2-3 days, i expect some upmove here
reason??? well, let me keep it secrete at this moment!!!
   |
hi...........casper
ekc is looking good................can I buy here @ 73.6 -73.8??............for tgt 80??.....if so pls advice
thanks
anand
|
|
| Back to top |
|
 |
sumesh_sol
Brown Belt

Joined: 06 Jun 2010
Posts: 2344
|
Post: #2190  Posted: Fri Mar 18, 2011 10:57 am Post subject: INDIACEM 60tf Posted: Fri Mar 18, 2011 10:57 am Post subject: INDIACEM 60tf |
 |
|
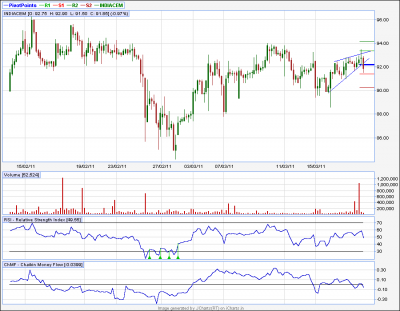
INDIACEM 60tf
***************
Casper, please confirm whether this is proper BO on rising wedge (bearish).
| Description: |
|
| Filesize: |
18.93 KB |
| Viewed: |
209 Time(s) |
|
|
|
| Back to top |
|
 |
|
|
You cannot post new topics in this forum
You cannot reply to topics in this forum
You cannot edit your posts in this forum
You cannot delete your posts in this forum
You cannot vote in polls in this forum
You can attach files in this forum
You can download files in this forum
|
Powered by phpBB © 2001, 2005 phpBB Group
|
|
|

