|
|
| View previous topic :: View next topic |
| Author |
a layman's approach to break out and break down |
casper
Green Belt

Joined: 02 Oct 2010
Posts: 1315
|
Post: #2191  Posted: Fri Mar 18, 2011 11:08 am Post subject: Posted: Fri Mar 18, 2011 11:08 am Post subject: |
 |
|
| anand1234 wrote: | | casper wrote: | its not a call for trading, i am running here and there, haphazardly as i am too busy now, but if any of u care, just watch bhartiship and ekc for 2-3 days, i expect some upmove here
reason??? well, let me keep it secrete at this moment!!!
   |
hi...........casper
ekc is looking good................can I buy here @ 73.6 -73.8??............for tgt 80??.....if so pls advice
thanks
anand |
if u r planning to buy for positional then dont buy on friday, u know, any thing happen in weekend and u may lose on monday
for positional, wait upto monday and when it trades above 755 start buying in installment with a sl of 74 and target 80
|
|
| Back to top |
|
 |
|
|  |
newinvestor
White Belt

Joined: 16 Feb 2010
Posts: 120
|
Post: #2192  Posted: Fri Mar 18, 2011 11:08 am Post subject: Posted: Fri Mar 18, 2011 11:08 am Post subject: |
 |
|
| casper wrote: | hii newinvestor!!!
after a long time,
yes adx will be very good tool to interpret bo/bd
i am currently working on that mostly, i am putting down the basic rules which i am testing
1.adx above 45-50=strong trend and mature one (it will either reverse or become choppy)
2.adx below 20= budding stage (meaning if u r long term player. start gathering goodies now, long trem player means, suppose u will buy 100qty and hold at least the total day but u r using 5tf instead of 60tf, so in comparison to a 5tf player, u r likely to hold longer, so u r, in my word, a long term player, i dont mean it for investors only, now out of 100 qty, start buying, say 20 at a time and average 5 times )
3.adx between 25-40= its ur time to take profit slowly as adx goes up
+di/-di above 40 means trend is over bought/over sold respectively, or going to be ob/os shortly
and a few more things also
in bo/bd, adx can replace macd, now if we use rsi with adx we can get excellent results
to all
i have sent a link to all those who have personal contact with me, out of forum, but those who can not contact me out of forum, plz download a free version of "METATRADER4" from any forex broker for free and start practicing paper trading with that demo a/c
i can not put those links, just google it and download and start paper trading.
apply what u know in forex/comm/internatioanl stocks, it will give u sound practice and makeu a formidable trader, if any help is needed, dont hesitate to knock me |
Casper, great input.
Just a few suggestions based on my study and whetever reading on the new:-
1. Can we say ADX below 20 - Time to start watching. I noticed that a slight upmove from below 20 at times fizzles out.
20 - 25 - entry point.
25-40 - watch for exits as the high momentum move happens.
Pls comment.
Kindly inform more on your work on using ADx and RSI together.
I had seen in an article on the net that using ADX and MACD together is good for gauging momentum and direction ( without using the DMI lines) . It goes something like this:-
1. Plot ADX above MACD.
2. When the two are diverging ( ADX up, MACD down, then high momentum down move.
3. When the two are confirming, (ADX up, MACD also up), high momentum up move. ADX down and MACD down, means low momentum down move.
4. When the two are converging ( ADX down, MACD up) , it means a low momentum upmove.
Seemed logical to me.
Your comments please.
Can anyone else also give their views and experiences in this.
|
|
| Back to top |
|
 |
casper
Green Belt

Joined: 02 Oct 2010
Posts: 1315
|
Post: #2193  Posted: Fri Mar 18, 2011 11:27 am Post subject: Re: INDIACEM 60tf Posted: Fri Mar 18, 2011 11:27 am Post subject: Re: INDIACEM 60tf |
 |
|
| sumesh_sol wrote: | INDIACEM 60tf
***************
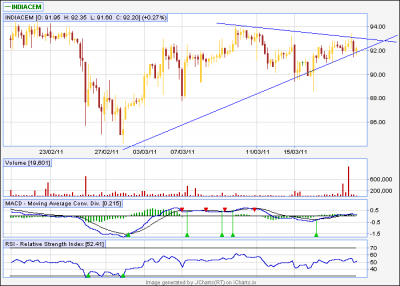
Casper, please confirm whether this is proper BO on rising wedge (bearish). |
sumesh bhai plz check it
we have a support to be broken in india cem
| Description: |
|
| Filesize: |
12.77 KB |
| Viewed: |
224 Time(s) |
|
|
|
| Back to top |
|
 |
sumesh_sol
Brown Belt

Joined: 06 Jun 2010
Posts: 2344
|
Post: #2194  Posted: Fri Mar 18, 2011 2:15 pm Post subject: JET 30TF.. Posted: Fri Mar 18, 2011 2:15 pm Post subject: JET 30TF.. |
 |
|
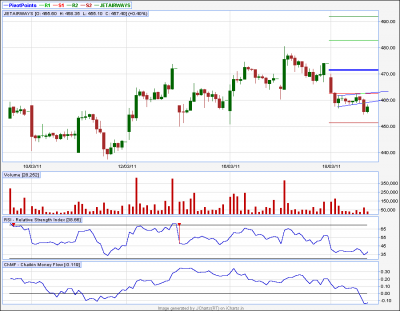
JET 30TF..
***********
Jet has broken bearish flag..
Now can be shorted with Sl - 463 and target 450
| Description: |
|
| Filesize: |
15.55 KB |
| Viewed: |
212 Time(s) |
|
|
|
| Back to top |
|
 |
singh.ravee
Yellow Belt

Joined: 12 Aug 2010
Posts: 678
|
Post: #2195  Posted: Sat Mar 19, 2011 10:40 am Post subject: Posted: Sat Mar 19, 2011 10:40 am Post subject: |
 |
|
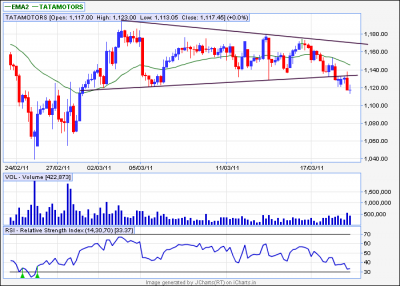
Casper Hello,
I think one can plan to go short in tatamotors 60min with this breakdown. Tgt here could be 1050.
Thanks and Regards
Ravee
| Description: |
|
| Filesize: |
19.9 KB |
| Viewed: |
216 Time(s) |
|
|
|
| Back to top |
|
 |
jjm
White Belt

Joined: 17 Mar 2010
Posts: 411
|
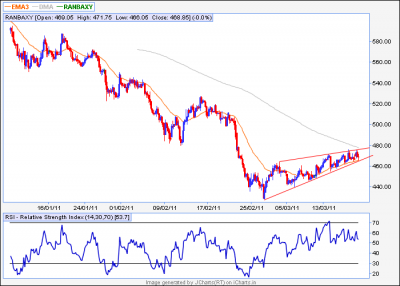
Post: #2196  Posted: Sat Mar 19, 2011 12:26 pm Post subject: Ranbaxy Posted: Sat Mar 19, 2011 12:26 pm Post subject: Ranbaxy |
 |
|
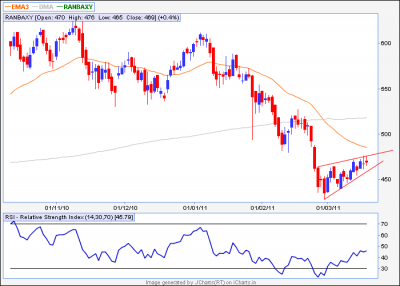
Dear Casper/Singh,
Hi!
Seasons Greetings
Comments/suggestion are most welcome

Regards,
JJM
| Description: |
|
| Filesize: |
18.19 KB |
| Viewed: |
200 Time(s) |
|
| Description: |
|
| Filesize: |
23.15 KB |
| Viewed: |
214 Time(s) |
|
|
|
| Back to top |
|
 |
girishhu1
White Belt

Joined: 17 Aug 2009
Posts: 316
|
Post: #2197  Posted: Sat Mar 19, 2011 12:53 pm Post subject: Posted: Sat Mar 19, 2011 12:53 pm Post subject: |
 |
|
hellow casperji,
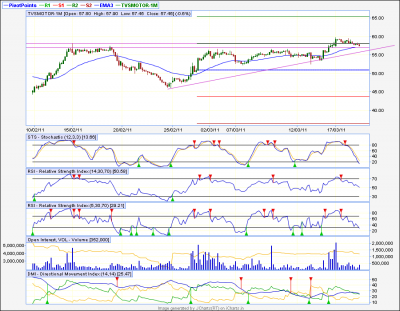
i entered tvs at 58.25, as i considered the bo above 58.2. the next support level seen by me is at 57. i plan to put stop loss at 57. my problem is if market opens gap down on monday, how the trade should be saved. pl guide.
| Description: |
|
| Filesize: |
52.75 KB |
| Viewed: |
205 Time(s) |
|
|
|
| Back to top |
|
 |
ali522003
White Belt

Joined: 03 Jul 2010
Posts: 217
|
Post: #2198  Posted: Sat Mar 19, 2011 4:53 pm Post subject: Posted: Sat Mar 19, 2011 4:53 pm Post subject: |
 |
|
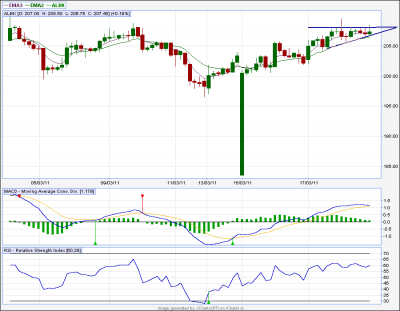
albk on 60tf
forming AT. experts are requested to please check and rectify if necessary.
| Description: |
|
| Filesize: |
18.03 KB |
| Viewed: |
200 Time(s) |
|
|
|
| Back to top |
|
 |
singh.ravee
Yellow Belt

Joined: 12 Aug 2010
Posts: 678
|
Post: #2199  Posted: Sat Mar 19, 2011 7:09 pm Post subject: Posted: Sat Mar 19, 2011 7:09 pm Post subject: |
 |
|
Casper Bhai,
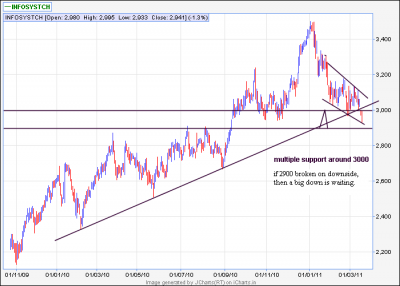
Infosystch eod for your consideration and your valuable comments.
Thanks and Regards
Ravee
| Description: |
|
| Filesize: |
29.11 KB |
| Viewed: |
198 Time(s) |
|
|
|
| Back to top |
|
 |
singh.ravee
Yellow Belt

Joined: 12 Aug 2010
Posts: 678
|
Post: #2200  Posted: Sat Mar 19, 2011 7:11 pm Post subject: Posted: Sat Mar 19, 2011 7:11 pm Post subject: |
 |
|
| ali522003 wrote: | albk on 60tf
forming AT. experts are requested to please check and rectify if necessary. |
Kindly check albk on eod before taking any decision.
thanks and regards
ravee
|
|
| Back to top |
|
 |
casper
Green Belt

Joined: 02 Oct 2010
Posts: 1315
|
Post: #2201  Posted: Sat Mar 19, 2011 7:53 pm Post subject: Posted: Sat Mar 19, 2011 7:53 pm Post subject: |
 |
|
| singh.ravee wrote: | Casper Hello,
I think one can plan to go short in tatamotors 60min with this breakdown. Tgt here could be 1050.
Thanks and Regards
Ravee |
hi paaji
there could be a gap up or a pull back here, we can short on rise as long as the channel's lower tl is not breached by an up move
|
|
| Back to top |
|
 |
casper
Green Belt

Joined: 02 Oct 2010
Posts: 1315
|
Post: #2202  Posted: Sat Mar 19, 2011 8:06 pm Post subject: Re: Ranbaxy Posted: Sat Mar 19, 2011 8:06 pm Post subject: Re: Ranbaxy |
 |
|
| jjm wrote: | Dear Casper/Singh,
Hi!
Seasons Greetings
Comments/suggestion are most welcome

Regards,
JJM |
hi jjm
happy holi to u also!!!
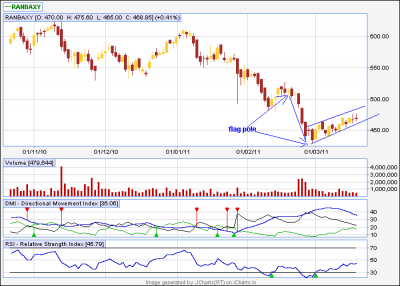
i dont know how u r planning to trade it and how u have interpreted this pattern, but anticipating u r planning to go long above the upper tl(assuming this as an ascending triangle) i am writing the following
in case of a strong AT (asecn trinagle) we need the patterns upper tl to be horizontal but here its slopped up
so this pattern is taking a shape of rising wedge which is a bearish pattern, although we can get some upmove above upper tl, but classical approach to trade this pattern is sell on bd, means sell on lower tl break down
again, if we re-arrange the trend lines in eod chart of ranbaxy, we can see a bearish flag also,
i am posting this bearish flag version
here the portion which is marked as flag pole, is the target after a downward breaks, price normally tends to travel this path after a successful break down from the lower tl
| Description: |
|
| Filesize: |
12.82 KB |
| Viewed: |
223 Time(s) |
|
|
|
| Back to top |
|
 |
casper
Green Belt

Joined: 02 Oct 2010
Posts: 1315
|
Post: #2203  Posted: Sat Mar 19, 2011 8:18 pm Post subject: Posted: Sat Mar 19, 2011 8:18 pm Post subject: |
 |
|
| girishhu1 wrote: | hellow casperji,
i entered tvs at 58.25, as i considered the bo above 58.2. the next support level seen by me is at 57. i plan to put stop loss at 57. my problem is if market opens gap down on monday, how the trade should be saved. pl guide. |
under a normal situation, a gap down will result in a fierce pull back and its good for bullish players so i am not really worried about a gap down
in case of a gap down, it will come down, make a base, and with some +ve div on rsi in 5 min, it will start heading north
in case of spot, i see 56 is a suitable place to make a base and with some +div, it may go up
but nowadays market is moving in some lunatic manners due to global cues, in that case, gap down and going down is not very impossible one
i hope it will go up once it touches 56 in spot, and if not, we may have to revert our trade and go short below this level
whatever it goes, i will update in live market for sure, even if i forget, plz knock me in forum or in gmail
|
|
| Back to top |
|
 |
casper
Green Belt

Joined: 02 Oct 2010
Posts: 1315
|
Post: #2204  Posted: Sat Mar 19, 2011 8:27 pm Post subject: Posted: Sat Mar 19, 2011 8:27 pm Post subject: |
 |
|
| ali522003 wrote: | albk on 60tf
forming AT. experts are requested to please check and rectify if necessary. |
as per ur chart,its okey, but given the current market situation, plz watch out before u take a trade, and as ravee paaji said , plz check eod once, last candle, as most of the stocks, is red one, though it formed, some what an at in eod too (except the last day)
so plz watch out
|
|
| Back to top |
|
 |
casper
Green Belt

Joined: 02 Oct 2010
Posts: 1315
|
Post: #2205  Posted: Sat Mar 19, 2011 8:36 pm Post subject: Posted: Sat Mar 19, 2011 8:36 pm Post subject: |
 |
|
| singh.ravee wrote: | Casper Bhai,
Infosystch eod for your consideration and your valuable comments.
Thanks and Regards
Ravee |
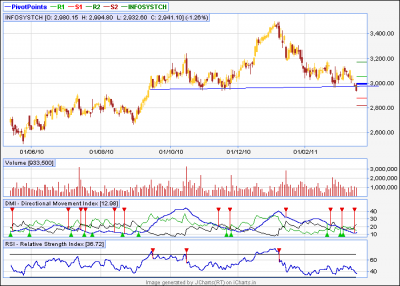
hii paaji, see the chart i am posting, i am sure, it will make u more happy!!!
(anna was talking about it in evening chat i guess, but could not follow him as i was in a hurry)
rsi is already 36, so i expect a red candle which will make rsi OS, then some pull back on Tues day and may be Wednesday, just to reach the neckline from monday's low.....which it should make on monday (if monday is not a gap down, or else pull back may come monday itself)
we can add positional short on that pull back if it comes and target at least 400 points at least in theory
| Description: |
|
| Filesize: |
15.83 KB |
| Viewed: |
258 Time(s) |
|
|
|
| Back to top |
|
 |
|
|
You cannot post new topics in this forum
You cannot reply to topics in this forum
You cannot edit your posts in this forum
You cannot delete your posts in this forum
You cannot vote in polls in this forum
You can attach files in this forum
You can download files in this forum
|
Powered by phpBB © 2001, 2005 phpBB Group
|
|
|

