| View previous topic :: View next topic |
| Author |
a layman's approach to break out and break down |
prasenjit
White Belt

Joined: 31 Dec 2010
Posts: 59
|
Post: #2206  Posted: Sat Mar 19, 2011 8:46 pm Post subject: Posted: Sat Mar 19, 2011 8:46 pm Post subject: |
 |
|
| Dear Casperda, nifty to nicher dike jacchhe....aro downside ki expect korte pari monday te......
|
|
| Back to top |
|
 |
|
|
 |
singh.ravee
Yellow Belt

Joined: 12 Aug 2010
Posts: 678
|
Post: #2207  Posted: Sat Mar 19, 2011 8:49 pm Post subject: Posted: Sat Mar 19, 2011 8:49 pm Post subject: |
 |
|
Casper Bhai,
i think infy remained hot topic for todays evening session in sb.
1. nitin sir posted, ew counts on infy.
2. marne.vivek posted h&s in infy.
3. veeru anna posted his number game on infy.
4.  I shared my trendline+ candlestick pattern on nifty. I am taking more conservative view, i.e. if it breaks 2900 then i will go short. I shared my trendline+ candlestick pattern on nifty. I am taking more conservative view, i.e. if it breaks 2900 then i will go short.
5. For pattern recognition, i always rely upon you. 
In short many were bearish on infy. If ppl are bearish on heavy weight how can we expect nifty to go up  
Thanks and Regards
Ravee
|
|
| Back to top |
|
 |
girishhu1
White Belt

Joined: 17 Aug 2009
Posts: 316
|
Post: #2208  Posted: Mon Mar 21, 2011 8:53 am Post subject: Posted: Mon Mar 21, 2011 8:53 am Post subject: |
 |
|
HI
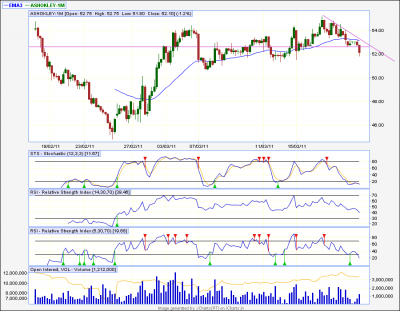
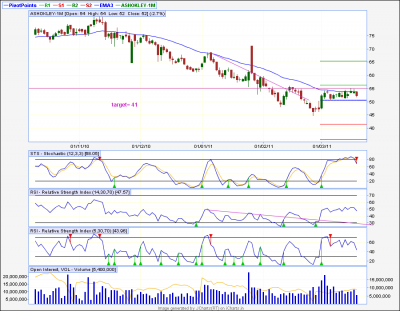
Enclosing a eod and 60m chart of ashok leyland indicating dt. kindly confirm
regards,
girish
| Description: |
|
| Filesize: |
44.25 KB |
| Viewed: |
257 Time(s) |
|
| Description: |
|
| Filesize: |
49.93 KB |
| Viewed: |
224 Time(s) |
|
|
|
| Back to top |
|
 |
casper
Green Belt

Joined: 02 Oct 2010
Posts: 1315
|
Post: #2209  Posted: Mon Mar 21, 2011 9:42 am Post subject: Posted: Mon Mar 21, 2011 9:42 am Post subject: |
 |
|
| girishhu1 wrote: | HI
Enclosing a eod and 60m chart of ashok leyland indicating dt. kindly confirm
regards,
girish |
if u r already short, try to book around mp at 50.53 in cash
|
|
| Back to top |
|
 |
ali522003
White Belt

Joined: 03 Jul 2010
Posts: 217
|
Post: #2210  Posted: Mon Mar 21, 2011 10:59 am Post subject: Posted: Mon Mar 21, 2011 10:59 am Post subject: |
 |
|
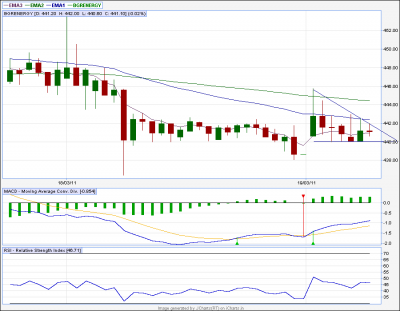
DT on 15 tf
| Description: |
|
| Filesize: |
14.01 KB |
| Viewed: |
227 Time(s) |
|
|
|
| Back to top |
|
 |
casper
Green Belt

Joined: 02 Oct 2010
Posts: 1315
|
Post: #2211  Posted: Mon Mar 21, 2011 11:09 am Post subject: Posted: Mon Mar 21, 2011 11:09 am Post subject: |
 |
|
| ali522003 wrote: | | DT on 15 tf |
when it starts breaking down in 15 tf, switch to 5 min tf and sell it below bd level on 5 min candle close and trail it
|
|
| Back to top |
|
 |
ali522003
White Belt

Joined: 03 Jul 2010
Posts: 217
|
Post: #2212  Posted: Mon Mar 21, 2011 12:08 pm Post subject: Posted: Mon Mar 21, 2011 12:08 pm Post subject: |
 |
|
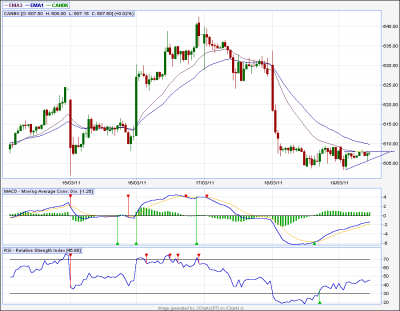
at on 15 tf
| Description: |
|
| Filesize: |
19.23 KB |
| Viewed: |
236 Time(s) |
|
|
|
| Back to top |
|
 |
ridinghood
Yellow Belt

Joined: 16 Apr 2009
Posts: 724
|
Post: #2213  Posted: Mon Mar 21, 2011 2:20 pm Post subject: Posted: Mon Mar 21, 2011 2:20 pm Post subject: |
 |
|
DEAR CASPER
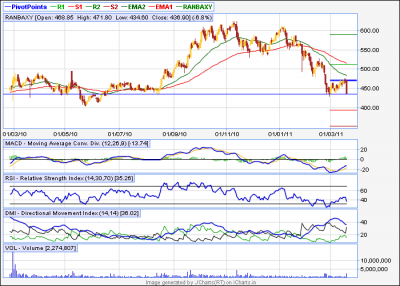
ur analysis of ranbaxy was simply awesome! the stock has crashed to 439 as of now in spot!where it can go to herefrom? can u guide for this month pl! many 2 thanks nd regards
ridinghood
|
|
| Back to top |
|
 |
ali522003
White Belt

Joined: 03 Jul 2010
Posts: 217
|
Post: #2214  Posted: Mon Mar 21, 2011 2:59 pm Post subject: Posted: Mon Mar 21, 2011 2:59 pm Post subject: |
 |
|
| casper wrote: | | ali522003 wrote: | | DT on 15 tf |
when it starts breaking down in 15 tf, switch to 5 min tf and sell it below bd level on 5 min candle close and trail it |
bgr bgr had a great fall 
|
|
| Back to top |
|
 |
jjm
White Belt

Joined: 17 Mar 2010
Posts: 411
|
Post: #2215  Posted: Mon Mar 21, 2011 4:08 pm Post subject: Re: Ranbaxy Posted: Mon Mar 21, 2011 4:08 pm Post subject: Re: Ranbaxy |
 |
|
Dear Casper,
Hi!
I had a plan to play as per BO/BD,
Hence,once we got BD waited for cc basis 60 tf below UTL..
Thanks for your valued inputs
Regards,
JJM
| casper wrote: | | jjm wrote: | Dear Casper/Singh,
Hi!
Seasons Greetings
Comments/suggestion are most welcome

Regards,
JJM |
hi jjm
happy holi to u also!!!
i dont know how u r planning to trade it and how u have interpreted this pattern, but anticipating u r planning to go long above the upper tl(assuming this as an ascending triangle) i am writing the following
in case of a strong AT (asecn trinagle) we need the patterns upper tl to be horizontal but here its slopped up
so this pattern is taking a shape of rising wedge which is a bearish pattern, although we can get some upmove above upper tl, but classical approach to trade this pattern is sell on bd, means sell on lower tl break down
again, if we re-arrange the trend lines in eod chart of ranbaxy, we can see a bearish flag also,
i am posting this bearish flag version
here the portion which is marked as flag pole, is the target after a downward breaks, price normally tends to travel this path after a successful break down from the lower tl |
|
|
| Back to top |
|
 |
jjm
White Belt

Joined: 17 Mar 2010
Posts: 411
|
Post: #2216  Posted: Mon Mar 21, 2011 4:10 pm Post subject: Posted: Mon Mar 21, 2011 4:10 pm Post subject: |
 |
|
Dear Ridinghood,
Pls see the reply Casper has posted ..he has clearly given the tgt for flag BD
Regards,
JJM
| ridinghood wrote: | DEAR CASPER
ur analysis of ranbaxy was simply awesome! the stock has crashed to 439 as of now in spot!where it can go to herefrom? can u guide for this month pl! many 2 thanks nd regards
ridinghood |
|
|
| Back to top |
|
 |
casper
Green Belt

Joined: 02 Oct 2010
Posts: 1315
|
Post: #2217  Posted: Mon Mar 21, 2011 8:58 pm Post subject: Posted: Mon Mar 21, 2011 8:58 pm Post subject: |
 |
|
hii ridinghood and jjm
(u know ridinghood, when i was replying on ranbaxy on weekend, i was thinking only of u  ) )
now in ranbaxy, we are on a trend line support, below this support, practically no support is seen upto 392,(monthly support level) and the total picture is critical too
if this support gone, then going the by the pattern, (rounding top) we will have a 150 point down move
but dont expect this move, if comes, to be a free fall one, there will be congestion, some pull back, but finally, below this tl, we will hit 300 level for sure
u may find i am joking, but i am really worried for the peoples who are trapped now and will be trapped more dangerously if this flat tl is gone
ps: nowadays brainstorming in some other market, plz dont feel bad if i get late to reply, i will try to reply all of u always before the next trading session in case u ask me any thing after 2pm, plz bear with me
| Description: |
|
| Filesize: |
29.95 KB |
| Viewed: |
243 Time(s) |
|
|
|
| Back to top |
|
 |
casper
Green Belt

Joined: 02 Oct 2010
Posts: 1315
|
Post: #2218  Posted: Mon Mar 21, 2011 10:08 pm Post subject: Posted: Mon Mar 21, 2011 10:08 pm Post subject: |
 |
|
prasenjit
every day u r asking and every day i am forgetting, sorry bhai
now as of nifty, as long as we hold 5370-5360 range we will try to go up and meaningful fall will come only below this level
as for tomorrow, if we dont get a gap up, then we will have a chance to visit 5420 in cash
in that case, we can go long, with a sl below 5370 and target 5410-5420
in case of gap up, just avoid buying as poisonous snake as long as nifty does not establish itself above 5420 in spot
this is only for tomorrow
|
|
| Back to top |
|
 |
ridinghood
Yellow Belt

Joined: 16 Apr 2009
Posts: 724
|
Post: #2219  Posted: Tue Mar 22, 2011 10:32 am Post subject: Posted: Tue Mar 22, 2011 10:32 am Post subject: |
 |
|
Dear Casper
thanxxxxx alottttttttttt for this brilliant ta on ranbaxy nd also for keeping a novice like me in mind!
just waiting for the tl to be broken!
regs
ridinghood[/quote]
|
|
| Back to top |
|
 |
ali522003
White Belt

Joined: 03 Jul 2010
Posts: 217
|
Post: #2220  Posted: Tue Mar 22, 2011 11:02 am Post subject: Posted: Tue Mar 22, 2011 11:02 am Post subject: |
 |
|
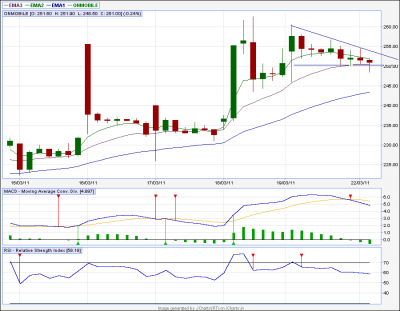
dt on onmobile on 60tf tgt 244
| Description: |
|
| Filesize: |
16.4 KB |
| Viewed: |
215 Time(s) |
|
|
|
| Back to top |
|
 |
|

