|
|
| View previous topic :: View next topic |
| Author |
a layman's approach to break out and break down |
casper
Green Belt

Joined: 02 Oct 2010
Posts: 1315
|
Post: #226  Posted: Sat Nov 13, 2010 10:58 pm Post subject: Posted: Sat Nov 13, 2010 10:58 pm Post subject: |
 |
|
yes u can short it, be careful about the lower end of bollinger band, it has just taken support there, a break below this level is shorting opportunity with a target of 288,285, watch out if it opens around 285 with a gap down, in that case dont short if it holds 285, 285 is its 50ema, a very important level.
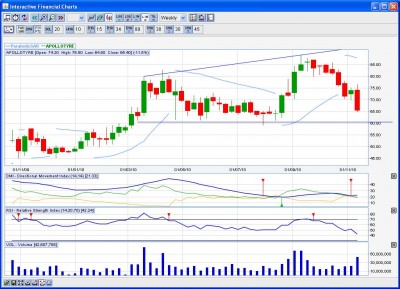
i dont track nifty much,becoz, s raj sir's column is so good that i never felt that need  , but as vishy (vishytns) referred and i checked, it look like a broadening top is forming, a break down below 6000 will confirm the pattern, in that case we may see 5700 , but as vishy (vishytns) referred and i checked, it look like a broadening top is forming, a break down below 6000 will confirm the pattern, in that case we may see 5700
renuka has gone down with huge volume,support is seen at 90,85 and 77, due to increased vol, it may go down to 77.
one thing i must mention here, during my trading, i always fear the 1st hour of monday, because after 2 days of gap, market tends to adjust itself on monday, in case of bearish friday closing, i hv seen heavy gap down followed by choppy moves and in case of bullish fri day, market tends to gap up and then choppy again,i dont know why, but i have seen it many times, so plz watch out the levels i mentioned in case of intraday trading, if u subscribe the real time chart, then plz see the 89 ema and 34ema in real time before entering a trade, these two ema specially 89, can chocke price movement considerably
|
|
| Back to top |
|
 |
|
|  |
newinvestor
White Belt

Joined: 16 Feb 2010
Posts: 120
|
Post: #227  Posted: Sat Nov 13, 2010 11:27 pm Post subject: Posted: Sat Nov 13, 2010 11:27 pm Post subject: |
 |
|
| casper wrote: | | newinvestor wrote: | | casper wrote: | dijyya thanks and welcome
newinvestor, once i posted a real time chart in st sir's thread, it was a 89 ema high and 89 ema low cross over chart and i asked him to comment on that,
he precisely told me that if i use ONLY ema crossover to take a trade then i will be successful only on heavy trending days, in case of choppy and nervous trading days, ema crossover is bound to make whipsaws,
so he told me to use a trend identifier indicator,among other indicators, he told me to use adx in particular and the result was good.
if u are not very accustomed with adx, u can try to use rsi also as it is one of the very simple indicators, in case of rsi, the thumb rule will be never go long when rsi in real time chart shows over bought nad never go short when rsi is oversold
normally a shorter and a higher ema is used to trade with ema cross over, u wrote about 20 ema but did not mention the another one,
let us assume that we are using 13 ema and 20 ema crossover along with rsi,
the idea of trade will be GO LONG WHEN THE SHORTER EMA IS CROSSING AND COMING ABOVE THE HIGHER EMA AND RSI IS OVERSOLD OR RISING BUT CERTAINLY NOT OVERBOUGHT
AND GO SHORT, WHEN THE SHORTER EMA IS CROSSING THE HIGHER EMA IN A DOWNWARD MOTION AND RSI IG GOING DOWN OR OVER BOUGHT BUT CERTAINLY NOT THE OVERSOLD
the logic behind is IN CASE OF A PRICE INCREMENT , THE SHORT TIME AVERAGE WILL BE GREATER THAN THE LONG TIME AVERAGE SO THE SHORTER EMA WILL CROSS HIGHER EMA IN A UPWARD MOTION
AND IN CASE OF CORRECTION THE SHORTER AVERAGE WILL BE LESSER THAN THE HIGHER AVERAGE SO IT WILL CROSS THE HIGHER EMA IN A DOWNWARD MOTION
the rsi reading will save us from shorting at a possible bottom and buying at a possible top
in short this is the basic structure of any ema cross over strategy, and personally as i follow the break out strategy even in real time chart, so i dont use ema crossover to trade |
Thanks Casper.
Guess I have a lot of home work to do. I was trying to use price crossing the 20 EMA. No wonder I had the whipsaws !! |
what kind of home work u r going to do? plz tell me if i could help u any way.its true that u have to gather experience on ur own to boost confidence, but if u need any information plz let me know |
I have been putting buy / sell limit orders in the system when price crosses the 20 EMA, with a 25 point stop loss. ( trying different methods) . Some moves turn out good.
I know this is a very basic method. I was thinking of doing some back testing with different EMAs.
Any suggestions are welcome.
|
|
| Back to top |
|
 |
measoldier
White Belt

Joined: 09 Sep 2010
Posts: 36
|
Post: #228  Posted: Sun Nov 14, 2010 12:24 am Post subject: Posted: Sun Nov 14, 2010 12:24 am Post subject: |
 |
|
| Thanx casper. I shall keep this in my mind
|
|
| Back to top |
|
 |
casper
Green Belt

Joined: 02 Oct 2010
Posts: 1315
|
Post: #229  Posted: Sun Nov 14, 2010 7:51 am Post subject: Posted: Sun Nov 14, 2010 7:51 am Post subject: |
 |
|
measoldier, thanks and welcome
hi newinvestor,
if u r using real time data, then plz try 34ema and as ema system is good for trending market so to identify the trend use any of the following indicators: adx. rsi.cci. stoch,or william %r, etc, they will show u the strength of trend, if
if u r using real time ichart, plz focus on ichart levels, u can find them in st sir's thread, he gave some thing like a live commentary of the market price and its reaction at the ichart levels, u can find them in his posts, he used a particular thread for a particular month, try to go through each of them, specially from august 2010,these are very informative and will show u how a trader is maintaining his cool during the market hour and with out getting biased about the market move,he is trading confidently
|
|
| Back to top |
|
 |
aromal
White Belt

Joined: 22 Mar 2010
Posts: 302
|
Post: #230  Posted: Sun Nov 14, 2010 7:59 am Post subject: Re: indian bank Posted: Sun Nov 14, 2010 7:59 am Post subject: Re: indian bank |
 |
|
| measoldier wrote: | hi casper,
attached is the daily chart of indian bank. seems it has closed a candle below the rising trendline of ascending triangle. well if it cud have broken on upside then it wud have been a bo, but now since it is a trend line break down . should we short it now as RSI is also decreasing?  
and wht do u think about nifty and renuka both dipped much on friday  |
indian bank will fall???? 
|
|
| Back to top |
|
 |
casper
Green Belt

Joined: 02 Oct 2010
Posts: 1315
|
Post: #231  Posted: Sun Nov 14, 2010 8:39 am Post subject: Re: indian bank Posted: Sun Nov 14, 2010 8:39 am Post subject: Re: indian bank |
 |
|
| aromal wrote: | | measoldier wrote: | hi casper,
attached is the daily chart of indian bank. seems it has closed a candle below the rising trendline of ascending triangle. well if it cud have broken on upside then it wud have been a bo, but now since it is a trend line break down . should we short it now as RSI is also decreasing?  
and wht do u think about nifty and renuka both dipped much on friday  |
indian bank will fall????  |
hi aromal,
i have given the answer, just quoting the 1st paragraph of the answer  , one thing to mention here,the bollinger band i have used here is of jchart eod, meaning its not bollinger band(20,2),its bollinger band (9) , one thing to mention here,the bollinger band i have used here is of jchart eod, meaning its not bollinger band(20,2),its bollinger band (9)
| casper wrote: | | yes u can short it, be careful about the lower end of bollinger band, it has just taken support there, a break below this level is shorting opportunity with a target of 288,285, watch out if it opens around 285 with a gap down, in that case dont short if it holds 285, 285 is its 50ema, a very important level. |
|
|
| Back to top |
|
 |
vishytns
White Belt

Joined: 26 Nov 2009
Posts: 206
|
Post: #232  Posted: Sun Nov 14, 2010 8:50 am Post subject: Posted: Sun Nov 14, 2010 8:50 am Post subject: |
 |
|
Casper,
Please check apollo tyres. Looks like broadening top. Please provide your comments.
Vishy
| Description: |
|
| Filesize: |
135.2 KB |
| Viewed: |
356 Time(s) |
|
|
|
| Back to top |
|
 |
vishytns
White Belt

Joined: 26 Nov 2009
Posts: 206
|
Post: #233  Posted: Sun Nov 14, 2010 8:52 am Post subject: Posted: Sun Nov 14, 2010 8:52 am Post subject: |
 |
|
Casper,
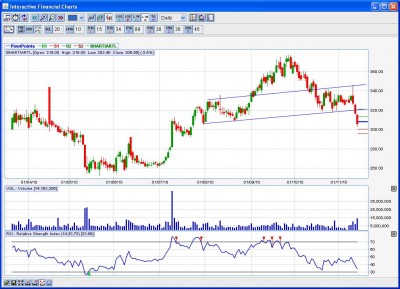
BHARTI, has formed head and shoulders. Price has also broken neckline. Provide your comments.
Vishy
| Description: |
|
| Filesize: |
126.47 KB |
| Viewed: |
345 Time(s) |
|
|
|
| Back to top |
|
 |
vishytns
White Belt

Joined: 26 Nov 2009
Posts: 206
|
Post: #234  Posted: Sun Nov 14, 2010 8:53 am Post subject: Posted: Sun Nov 14, 2010 8:53 am Post subject: |
 |
|
casper,
IS BPCL forming an descending triangle?
Vishy.
|
|
| Back to top |
|
 |
vishytns
White Belt

Joined: 26 Nov 2009
Posts: 206
|
Post: #235  Posted: Sun Nov 14, 2010 8:54 am Post subject: Posted: Sun Nov 14, 2010 8:54 am Post subject: |
 |
|
casper,
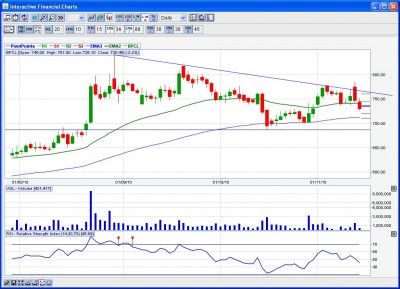
IS BPCL forming an descending triangle?
Vishy.
| Description: |
|
| Filesize: |
124.08 KB |
| Viewed: |
303 Time(s) |
|
|
|
| Back to top |
|
 |
vishytns
White Belt

Joined: 26 Nov 2009
Posts: 206
|
Post: #236  Posted: Sun Nov 14, 2010 8:57 am Post subject: Posted: Sun Nov 14, 2010 8:57 am Post subject: |
 |
|
Casper,
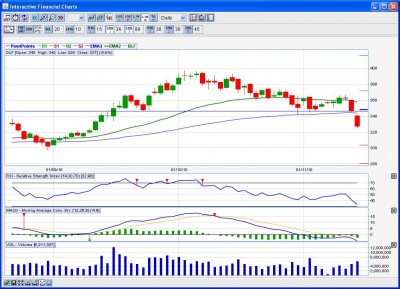
DLF has formed an head and shoulders and broken the neckline. Your views please.
In general in case of head and shoulders will the price retrace back to neck line after breaking below neckline?
Vishy.
| Description: |
|
| Filesize: |
134.04 KB |
| Viewed: |
325 Time(s) |
|
|
|
| Back to top |
|
 |
vishytns
White Belt

Joined: 26 Nov 2009
Posts: 206
|
Post: #237  Posted: Sun Nov 14, 2010 9:07 am Post subject: Posted: Sun Nov 14, 2010 9:07 am Post subject: |
 |
|
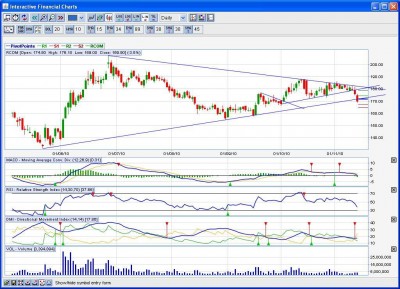
casper,
HAS RCOM broken down below the Symmetrical Triangle? Check the chart and let us know your views.
Vishy.
| Description: |
|
| Filesize: |
146.55 KB |
| Viewed: |
333 Time(s) |
|
|
|
| Back to top |
|
 |
vishytns
White Belt

Joined: 26 Nov 2009
Posts: 206
|
Post: #238  Posted: Sun Nov 14, 2010 9:08 am Post subject: Posted: Sun Nov 14, 2010 9:08 am Post subject: |
 |
|
Casper,
Broadening Top formation in following Stocks?
Essar Oil (Daily chart)
IBREALEST (Daily Chart)
ICICIBANK (Daily Chart)
Your views please.
Vishy
|
|
| Back to top |
|
 |
vishytns
White Belt

Joined: 26 Nov 2009
Posts: 206
|
Post: #239  Posted: Sun Nov 14, 2010 9:12 am Post subject: Posted: Sun Nov 14, 2010 9:12 am Post subject: |
 |
|
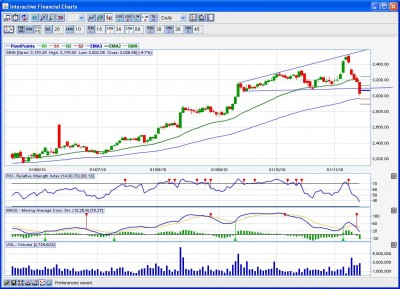
Casper,
Broadening Top Break down in SBI? Check the chart and comment.
Vishy
| Description: |
|
| Filesize: |
142.7 KB |
| Viewed: |
343 Time(s) |
|
|
|
| Back to top |
|
 |
vishytns
White Belt

Joined: 26 Nov 2009
Posts: 206
|
Post: #240  Posted: Sun Nov 14, 2010 9:18 am Post subject: Posted: Sun Nov 14, 2010 9:18 am Post subject: |
 |
|
Casper,
In your study, what is the probability of price retracing back to break down/break out line (after break down/break out)? Many of the stocks have broken down the price patterns they have formed. Will there be any retracements in comming days?
vishy.
|
|
| Back to top |
|
 |
|
|
You cannot post new topics in this forum
You cannot reply to topics in this forum
You cannot edit your posts in this forum
You cannot delete your posts in this forum
You cannot vote in polls in this forum
You can attach files in this forum
You can download files in this forum
|
Powered by phpBB © 2001, 2005 phpBB Group
|
|
|

