|
|
| View previous topic :: View next topic |
| Author |
a layman's approach to break out and break down |
casper
Green Belt

Joined: 02 Oct 2010
Posts: 1315
|
Post: #2281  Posted: Sun Mar 27, 2011 10:14 pm Post subject: Posted: Sun Mar 27, 2011 10:14 pm Post subject: |
 |
|
| anandrathi12 wrote: | | casper wrote: | | anandrathi12 wrote: | Hi Casper/ravee
Is it a bearish flag formation in Nifty Weekly chart...? please give ur views...
Thanks and Regards,
Anand |
hii mr rathi!!!
yes it is a bearish flag. and this pattern is seen in eod chart too, (attached chart in eod version)as per my assumption, 5700, to be precise 5725-5750 is going to be a trend decider
its a strong resi and from here, we can expect a fall, as of now, we have strong chance to become range bound, the pattern, depending upon upside/downside break will decide the future course of our market
ps: bearish flag, as per my exp, is not very reliable pattern, or may be i am yet to discover the proper way to trade it, so though i am still bearish some where in my mind, still i would like to wait for a break in either side to take a call |
HI Casper...
thanks for ur rply...
cn u tell what inference cn be obtained from following points...
1)in eod chart the breakout was accompanied with good volumes... (bt i thnk part of it may be due to short covering....)
2)in weekly charts we cn see a large green candle bt the very low volumes...
3)and u hv also mentioned in one post that adx did nt accompany the upmove in eod....
so overall ths looks like a kind of trap.. need ur expert view on the same....
thanks and regards,
anand |
okey anand bhai. let me reply things one by one
1. first of all, we cant call this break out with good volume, bcoz, we have just normal volume here, a break out volume should be much larger than average days volume, here its merely a gross volume day
2. in eod as well as weekly chart we miss strong volume, that shows, this move is largely made by short covering sides, there are lots of guys who were short and got their sl hit (both positional and intra players, positional got their trailing sl hit and booked profit and intra players booked loss) open interest data also shows the same thing,
3.i do not have experience of decades but for last two years, i am virtually living with triangles, this eod nifty AT has broken out from mid part, i can not remember any occasion where such unexpected break resulted a longer trend, it usually becomes a trap only ( a triangle is supposed to be broken at the tip of the pattern, not from the mid range)
4.and u have rightly mentioned that adx point too, so i am some what suspicious about the move, and will be bullish only above 5750
at the same time, i know lots of peoples follow our thread, so i dont want to put an extreme view here bcoz whomever is predicting about nifty, only speculating, and fresher can be trapped if my views are extreme and goes wrong.... i have some experience, i know how to minimize the loss if i am at the wrong side, but most guys do not know that so i will not call it trap openly, i will suggest all of u, watch out, every thing is not alright here, so look before you leap
|
|
| Back to top |
|
 |
|
|  |
singh.ravee
Yellow Belt

Joined: 12 Aug 2010
Posts: 678
|
Post: #2282  Posted: Sun Mar 27, 2011 10:28 pm Post subject: Posted: Sun Mar 27, 2011 10:28 pm Post subject: |
 |
|
Casper Bhai Hello,
Just would like to add one thing to ur nifty reply.
I am not expecting an inverted v kind of reversal in nifty. nifty may move till 5750 kind of level, consolidate a bit and then may retrace.
As per edward magee theory on triangles, what we have seen is a bottom reversal in nifty. Volume is a concern and I agree that we are still not out of the woods. Meanwhile I am playing nifty with smaller and strict SL. Long is still open. 
Thanks and Regards
Ravee
|
|
| Back to top |
|
 |
anandrathi12
White Belt

Joined: 01 Dec 2010
Posts: 38
|
Post: #2283  Posted: Sun Mar 27, 2011 10:38 pm Post subject: Posted: Sun Mar 27, 2011 10:38 pm Post subject: |
 |
|
| casper wrote: | | anandrathi12 wrote: | | casper wrote: | | anandrathi12 wrote: | Hi Casper/ravee
Is it a bearish flag formation in Nifty Weekly chart...? please give ur views...
Thanks and Regards,
Anand |
hii mr rathi!!!
yes it is a bearish flag. and this pattern is seen in eod chart too, (attached chart in eod version)as per my assumption, 5700, to be precise 5725-5750 is going to be a trend decider
its a strong resi and from here, we can expect a fall, as of now, we have strong chance to become range bound, the pattern, depending upon upside/downside break will decide the future course of our market
ps: bearish flag, as per my exp, is not very reliable pattern, or may be i am yet to discover the proper way to trade it, so though i am still bearish some where in my mind, still i would like to wait for a break in either side to take a call |
HI Casper...
thanks for ur rply...
cn u tell what inference cn be obtained from following points...
1)in eod chart the breakout was accompanied with good volumes... (bt i thnk part of it may be due to short covering....)
2)in weekly charts we cn see a large green candle bt the very low volumes...
3)and u hv also mentioned in one post that adx did nt accompany the upmove in eod....
so overall ths looks like a kind of trap.. need ur expert view on the same....
thanks and regards,
anand |
okey anand bhai. let me reply things one by one
1. first of all, we cant call this break out with good volume, bcoz, we have just normal volume here, a break out volume should be much larger than average days volume, here its merely a gross volume day
2. in eod as well as weekly chart we miss strong volume, that shows, this move is largely made by short covering sides, there are lots of guys who were short and got their sl hit (both positional and intra players, positional got their trailing sl hit and booked profit and intra players booked loss) open interest data also shows the same thing,
3.i do not have experience of decades but for last two years, i am virtually living with triangles, this eod nifty AT has broken out from mid part, i can not remember any occasion where such unexpected break resulted a longer trend, it usually becomes a trap only ( a triangle is supposed to be broken at the tip of the pattern, not from the mid range)
4.and u have rightly mentioned that adx point too, so i am some what suspicious about the move, and will be bullish only above 5750
at the same time, i know lots of peoples follow our thread, so i dont want to put an extreme view here bcoz whomever is predicting about nifty, only speculating, and fresher can be trapped if my views are extreme and goes wrong.... i have some experience, i know how to minimize the loss if i am at the wrong side, but most guys do not know that so i will not call it trap openly, i will suggest all of u, watch out, every thing is not alright here, so look before you leap |
thanks a lot casper bhai....
regards,
anand
|
|
| Back to top |
|
 |
trades4girish
White Belt

Joined: 10 Jul 2009
Posts: 22
|
Post: #2284  Posted: Mon Mar 28, 2011 10:03 am Post subject: Nifty (Spot) on BO or BD on 5Min TF Posted: Mon Mar 28, 2011 10:03 am Post subject: Nifty (Spot) on BO or BD on 5Min TF |
 |
|
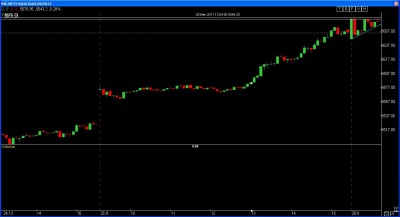
Dear All,
Please see the following chart of NS 5Min TF ready for breakout with AT.
| Description: |
|
| Filesize: |
71.23 KB |
| Viewed: |
249 Time(s) |

|
|
|
| Back to top |
|
 |
ridinghood
Yellow Belt

Joined: 16 Apr 2009
Posts: 724
|
Post: #2285  Posted: Mon Mar 28, 2011 10:09 am Post subject: Posted: Mon Mar 28, 2011 10:09 am Post subject: |
 |
|
Dear casper
thnx alot for ur detailed response to my query nd also for encouraging people like me!
the effort u r putting in will certainly not go in vain.u have created lot of good will among the ichartians nd no one can deny u great success that is for sure!
regs
ridinghood
|
|
| Back to top |
|
 |
sumesh_sol
Brown Belt

Joined: 06 Jun 2010
Posts: 2344
|
Post: #2286  Posted: Mon Mar 28, 2011 10:15 am Post subject: Godrejind Posted: Mon Mar 28, 2011 10:15 am Post subject: Godrejind |
 |
|
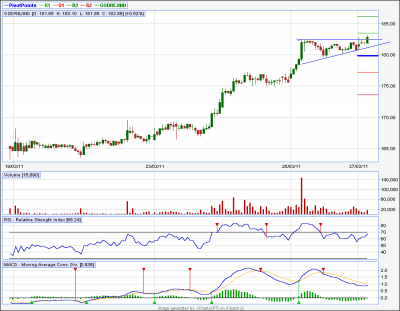
Godrejind .. 15tf..
********************
Looks good or upmove, can touch 186/188
| Description: |
|
| Filesize: |
15.23 KB |
| Viewed: |
216 Time(s) |

|
|
|
| Back to top |
|
 |
anand1234
Yellow Belt

Joined: 17 Jul 2010
Posts: 830
|
Post: #2287  Posted: Mon Mar 28, 2011 10:53 am Post subject: Re: Godrejind Posted: Mon Mar 28, 2011 10:53 am Post subject: Re: Godrejind |
 |
|
| sumesh_sol wrote: | Godrejind .. 15tf..
********************
Looks good or upmove, can touch 186/188 |
hi...........sumesh
I bought godrej @ 184.5............now 183.9............shd I average here??.............for tgt 186??...........if so pls guide me.........any s/l??
thanks
anand
|
|
| Back to top |
|
 |
sumesh_sol
Brown Belt

Joined: 06 Jun 2010
Posts: 2344
|
Post: #2288  Posted: Mon Mar 28, 2011 11:22 am Post subject: Re: Godrejind Posted: Mon Mar 28, 2011 11:22 am Post subject: Re: Godrejind |
 |
|
| anand1234 wrote: | | sumesh_sol wrote: | Godrejind .. 15tf..
********************
Looks good or upmove, can touch 186/188 |
hi...........sumesh
I bought godrej @ 184.5............now 183.9............shd I average here??.............for tgt 186??...........if so pls guide me.........any s/l??
thanks
anand |
Anand, Sorry for late reply.. See it broke AT at around 182.5 on 15 tf.. so a close in 15 tf below this is SL.. No averaging.... either target or SL...
|
|
| Back to top |
|
 |
casper
Green Belt

Joined: 02 Oct 2010
Posts: 1315
|
Post: #2289  Posted: Mon Mar 28, 2011 12:05 pm Post subject: Posted: Mon Mar 28, 2011 12:05 pm Post subject: |
 |
|
| singh.ravee wrote: | Casper Bhai Hello,
Just would like to add one thing to ur nifty reply.
I am not expecting an inverted v kind of reversal in nifty. nifty may move till 5750 kind of level, consolidate a bit and then may retrace.
As per edward magee theory on triangles, what we have seen is a bottom reversal in nifty. Volume is a concern and I agree that we are still not out of the woods. Meanwhile I am playing nifty with smaller and strict SL. Long is still open. 
Thanks and Regards
Ravee |
sorry paaji for late reply, nowa days busy like hell,
plz exercise extreme caution in any nifty position, the nifty option data is showing evidence of mad charge, in either direction, which can strt any time,
remember dr elder "only ur solid risk management can separate u from mad crowds" market may become mad, but we dont need to be a mad, we are here to stay, so dont waste all ur force in a single battle
|
|
| Back to top |
|
 |
casper
Green Belt

Joined: 02 Oct 2010
Posts: 1315
|
Post: #2290  Posted: Mon Mar 28, 2011 12:06 pm Post subject: Posted: Mon Mar 28, 2011 12:06 pm Post subject: |
 |
|
| ridinghood wrote: | Dear casper
thnx alot for ur detailed response to my query nd also for encouraging people like me!
the effort u r putting in will certainly not go in vain.u have created lot of good will among the ichartians nd no one can deny u great success that is for sure!
regs
ridinghood |
thanks and welcome brother
one more question if u dont mind..... 
i am tushar, u???
|
|
| Back to top |
|
 |
anand1234
Yellow Belt

Joined: 17 Jul 2010
Posts: 830
|
Post: #2291  Posted: Mon Mar 28, 2011 12:11 pm Post subject: Re: Godrejind Posted: Mon Mar 28, 2011 12:11 pm Post subject: Re: Godrejind |
 |
|
| sumesh_sol wrote: | Godrejind .. 15tf..
********************
Looks good or upmove, can touch 186/188 |
hi...........sumesh
great call................godrej from 283 to 286.................rockkkkkkkkking man.............pls keep posting
thanks
anand
|
|
| Back to top |
|
 |
sumesh_sol
Brown Belt

Joined: 06 Jun 2010
Posts: 2344
|
Post: #2292  Posted: Mon Mar 28, 2011 12:16 pm Post subject: Re: Godrejind Posted: Mon Mar 28, 2011 12:16 pm Post subject: Re: Godrejind |
 |
|
| anand1234 wrote: | | sumesh_sol wrote: | Godrejind .. 15tf..
********************
Looks good or upmove, can touch 186/188 |
hi...........sumesh
great call................godrej from 283 to 286.................rockkkkkkkkking man.............pls keep posting
thanks
anand |
It is 183 to 186 Anand bhai, Tumhe bhi meri beemari lag gayi(Typing mistakes)... 
Keep faith in yourself, be observant of price action, you shall be rewarded..
|
|
| Back to top |
|
 |
anand1234
Yellow Belt

Joined: 17 Jul 2010
Posts: 830
|
Post: #2293  Posted: Mon Mar 28, 2011 12:20 pm Post subject: Re: Godrejind Posted: Mon Mar 28, 2011 12:20 pm Post subject: Re: Godrejind |
 |
|
| sumesh_sol wrote: | | anand1234 wrote: | | sumesh_sol wrote: | Godrejind .. 15tf..
********************
Looks good or upmove, can touch 186/188 |
hi...........sumesh
great call................godrej from 283 to 286.................rockkkkkkkkking man.............pls keep posting
thanks
anand |
It is 183 to 186 Anand bhai, Tumhe bhi meri beemari lag gayi(Typing mistakes)... 
Keep faith in yourself, be observant of price action, you shall be rewarded.. |
hi...........sumesh
ya .........u r right boss...............next time I shd remember that..............so keep such posting
thanks again
anand
|
|
| Back to top |
|
 |
ali522003
White Belt

Joined: 03 Jul 2010
Posts: 217
|
Post: #2294  Posted: Mon Mar 28, 2011 12:20 pm Post subject: Posted: Mon Mar 28, 2011 12:20 pm Post subject: |
 |
|
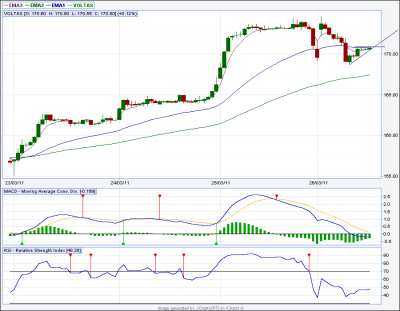
voltas forming a not very impressive at but rsi forming at and abv 172 it will cross monthly pivot too so one can buy abv that.
| Description: |
|
| Filesize: |
16.29 KB |
| Viewed: |
222 Time(s) |

|
|
|
| Back to top |
|
 |
anand1234
Yellow Belt

Joined: 17 Jul 2010
Posts: 830
|
Post: #2295  Posted: Mon Mar 28, 2011 12:22 pm Post subject: Posted: Mon Mar 28, 2011 12:22 pm Post subject: |
 |
|
| ali522003 wrote: | | voltas forming a not very impressive dt but rsi forming at and abv 172 it will cross monthly pivot too so one can buy abv that. |
hi............ali
any tgt above 172.........................pls guide us
thanks
anand
|
|
| Back to top |
|
 |
|
|
You cannot post new topics in this forum
You cannot reply to topics in this forum
You cannot edit your posts in this forum
You cannot delete your posts in this forum
You cannot vote in polls in this forum
You can attach files in this forum
You can download files in this forum
|
Powered by phpBB © 2001, 2005 phpBB Group
|
|
|

