|
|
| View previous topic :: View next topic |
| Author |
a layman's approach to break out and break down |
viraj5
White Belt

Joined: 23 Jul 2010
Posts: 32
|
Post: #2356  Posted: Fri Apr 01, 2011 6:53 pm Post subject: Kindly Advise Posted: Fri Apr 01, 2011 6:53 pm Post subject: Kindly Advise |
 |
|
we can chk EMA 30 with 30 min alone without any supportive indicators??? We have to apply theses settings to J Chart Prem ??? Please help I am new user.
Best Regards
Viraj
|
|
| Back to top |
|
 |
|
|  |
casper
Green Belt

Joined: 02 Oct 2010
Posts: 1315
|
Post: #2357  Posted: Fri Apr 01, 2011 8:01 pm Post subject: Re: Kindly Advise Posted: Fri Apr 01, 2011 8:01 pm Post subject: Re: Kindly Advise |
 |
|
| viraj5 wrote: | we can chk EMA 30 with 30 min alone without any supportive indicators??? We have to apply theses settings to J Chart Prem ??? Please help I am new user.
Best Regards
Viraj |
hi viraj,
what u r up to? cud not understand ur query, plz write in details.
if u need any help regarding jchart premium, just clik on the "download jchart premium help" link, it will guide u about how to and from where to adjust things for jcharts premium
if u want to ask about any particular strategy then plz write in details
|
|
| Back to top |
|
 |
viraj5
White Belt

Joined: 23 Jul 2010
Posts: 32
|
Post: #2358  Posted: Fri Apr 01, 2011 8:48 pm Post subject: Posted: Fri Apr 01, 2011 8:48 pm Post subject: |
 |
|
I am discussing about strategy which you have mentioned earlier about breakout of stocks.If we apply setting to chart premium or EOD charts .If we apply 34 EMA to chk breakout alone will be a good enough or we need to apply other indicators.
thank you for kind help
Best Regards
Viraj
|
|
| Back to top |
|
 |
casper
Green Belt

Joined: 02 Oct 2010
Posts: 1315
|
Post: #2359  Posted: Fri Apr 01, 2011 9:46 pm Post subject: Posted: Fri Apr 01, 2011 9:46 pm Post subject: |
 |
|
i am writing a few points, plz judge them with previously posted chart to see the examples, u can follow my posted chart, but following the chart of sumesh.sol or vishytns will also do, as they are of best slandered
1.we apply our rules only for ascending (at) and descending finagler(dt)
2.we use macd and rsi indicator for confirming a break
3.we have seen that presence of any of the following levels will cause serious obstacle to a smooth move, so we use following levels for profit booking or sl
weekly/monthly pivot and associated level, 34 ema/89 ema
so normally, we find at/dt
check macd and rsi
even before taking a position, we check for aforesaid levels to see how far we can go with out confronting any of these levels
in short, this is our break out trading system
from time to time, i hv discussed a few others strategies also, from my personal experience, i can say, these levels as well as ema are really strong for any time frame any strategy to break easily, thus they provide excellent scope of using them as profit booking level and stop loss levels
|
|
| Back to top |
|
 |
viraj5
White Belt

Joined: 23 Jul 2010
Posts: 32
|
Post: #2360  Posted: Fri Apr 01, 2011 9:50 pm Post subject: Thank You !! Posted: Fri Apr 01, 2011 9:50 pm Post subject: Thank You !! |
 |
|
Dear Sir,
Thank you for your kind support.I got it.Where I can find more your valuable previous post.I will be thankful if you kindly give me link.
Best Regards
Viraj
|
|
| Back to top |
|
 |
casper
Green Belt

Joined: 02 Oct 2010
Posts: 1315
|
Post: #2361  Posted: Fri Apr 01, 2011 11:03 pm Post subject: Posted: Fri Apr 01, 2011 11:03 pm Post subject: |
 |
|
plz check first a few pages viz, from page 236 to say 225, i have all all the imp pattern descriptions there, then get back here and start browsing from the latest pages like 1-20, it will give u an understanding of how we are working on it
this thread has got 236 pages, even i , myself dont know what is written in which page
  
just notice one thin always NO MATTER HOW GOOD THE PATTERNS IS, WE DONT BUY IN OVER BOUGHT RSI AND WE DONT SELL IN OVERSOLD RSI, exceptions may be there, but thats only exception, thats not rule
any more question? plz dont hesitate to ask
|
|
| Back to top |
|
 |
viraj5
White Belt

Joined: 23 Jul 2010
Posts: 32
|
Post: #2362  Posted: Fri Apr 01, 2011 11:15 pm Post subject: Thank You !! Posted: Fri Apr 01, 2011 11:15 pm Post subject: Thank You !! |
 |
|
Dear Casperji,
Thank you very much for your kind support. RSI overbought @ 70 level & oversold position @ below 20 Level ?????
In you past discussions you are using SMA 1 = 30 ????
Thanks & Regards
Viraj
|
|
| Back to top |
|
 |
viraj5
White Belt

Joined: 23 Jul 2010
Posts: 32
|
Post: #2363  Posted: Fri Apr 01, 2011 11:17 pm Post subject: Thank You !! Posted: Fri Apr 01, 2011 11:17 pm Post subject: Thank You !! |
 |
|
Dear Casperji,
Thank you very much for your kind support. RSI overbought @ 70 level & oversold position @ below 20 Level ?????
In you past discussions you are using SMA 1 = 30 ????
Thanks & Regards
Viraj
|
|
| Back to top |
|
 |
casper
Green Belt

Joined: 02 Oct 2010
Posts: 1315
|
Post: #2364  Posted: Fri Apr 01, 2011 11:30 pm Post subject: Re: Thank You !! Posted: Fri Apr 01, 2011 11:30 pm Post subject: Re: Thank You !! |
 |
|
| viraj5 wrote: | Dear Casperji,
Thank you very much for your kind support. RSI overbought @ 70 level & oversold position @ below 20 Level ?????
In you past discussions you are using SMA 1 = 30 ????
Thanks & Regards
Viraj |
1st of all, plz dont call me sir or casper ji. call me casper, if u like, call me brother, this is the way most ichartian calls me, 
ob is 70 or above and os is 30 or below, its for normal market, during extreme moves, like which we have a few days ago in nifty, rsi can be above 80 and stay there, in those days rsi will become extreme bullish or extreme bearish, depending up on market move, but in those days , we can take position with ob/os rsi also, this the exception case i wrote about in last post
t.a is more of an art than a science, so u need to develop ur own insight to judge things, but we can safely conclude, during normal market, above 70 or below 30 rsi is dangerous thing
i use mostly 34/89 ema combination and they are really rocking so far, however, depending up on ur trade time frame, such as intra, btst, short term u can use any "fibonacci" number ema like 8/13/21/34/89
|
|
| Back to top |
|
 |
ronypan
White Belt

Joined: 07 Aug 2010
Posts: 197
|
Post: #2365  Posted: Sat Apr 02, 2011 2:12 pm Post subject: Re: Thank You !! Posted: Sat Apr 02, 2011 2:12 pm Post subject: Re: Thank You !! |
 |
|
| casper wrote: | | viraj5 wrote: | Dear Casperji,
Thank you very much for your kind support. RSI overbought @ 70 level & oversold position @ below 20 Level ?????
In you past discussions you are using SMA 1 = 30 ????
Thanks & Regards
Viraj |
1st of all, plz dont call me sir or casper ji. call me casper, if u like, call me brother, this is the way most ichartian calls me, 
ob is 70 or above and os is 30 or below, its for normal market, during extreme moves, like which we have a few days ago in nifty, rsi can be above 80 and stay there, in those days rsi will become extreme bullish or extreme bearish, depending up on market move, but in those days , we can take position with ob/os rsi also, this the exception case i wrote about in last post
t.a is more of an art than a science, so u need to develop ur own insight to judge things, but we can safely conclude, during normal market, above 70 or below 30 rsi is dangerous thing
i use mostly 34/89 ema combination and they are really rocking so far, however, depending up on ur trade time frame, such as intra, btst, short term u can use any "fibonacci" number ema like 8/13/21/34/89 |
Superb explained... nobody goes in such dips..
|
|
| Back to top |
|
 |
ronypan
White Belt

Joined: 07 Aug 2010
Posts: 197
|
Post: #2366  Posted: Sat Apr 02, 2011 4:21 pm Post subject: Posted: Sat Apr 02, 2011 4:21 pm Post subject: |
 |
|
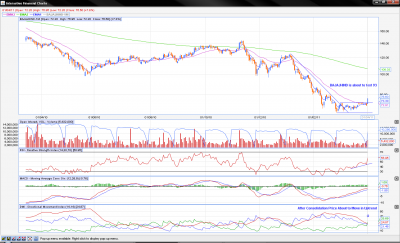
BAJAJHIND FUT ABOUT TO TEST 93.
CAN BUY WITH SL OF 71.9
| Description: |
|
| Filesize: |
133.75 KB |
| Viewed: |
251 Time(s) |

|
|
|
| Back to top |
|
 |
casper
Green Belt

Joined: 02 Oct 2010
Posts: 1315
|
Post: #2367  Posted: Sun Apr 03, 2011 8:17 pm Post subject: Posted: Sun Apr 03, 2011 8:17 pm Post subject: |
 |
|
| ronypan wrote: | BAJAJHIND FUT ABOUT TO TEST 93.
CAN BUY WITH SL OF 71.9 |
plz be careful rony, we are at monthly pivot level here
|
|
| Back to top |
|
 |
ronypan
White Belt

Joined: 07 Aug 2010
Posts: 197
|
Post: #2368  Posted: Sun Apr 03, 2011 8:51 pm Post subject: Posted: Sun Apr 03, 2011 8:51 pm Post subject: |
 |
|
| casper wrote: | | ronypan wrote: | BAJAJHIND FUT ABOUT TO TEST 93.
CAN BUY WITH SL OF 71.9 |
plz be careful rony, we are at monthly pivot level here |
ya sure thanks..
|
|
| Back to top |
|
 |
ronypan
White Belt

Joined: 07 Aug 2010
Posts: 197
|
Post: #2369  Posted: Sun Apr 03, 2011 8:52 pm Post subject: Posted: Sun Apr 03, 2011 8:52 pm Post subject: |
 |
|
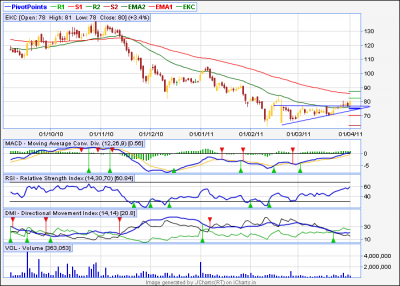
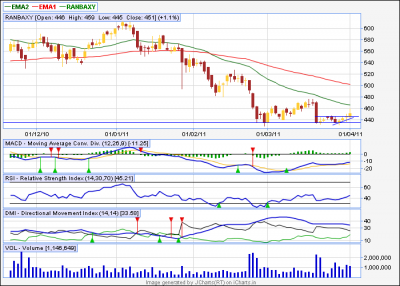
RANBAXY CMP 450.55 SL 444 TGT 489, 503
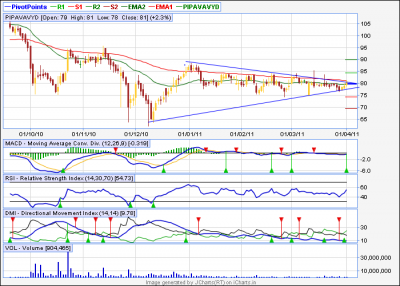
PIPAVAVYD CMP 80.65 SL 76 TGT 92.15, 97.05, 102
EDUCOMP CMP 431.1 SL 424 MX SL 421 TGT 464, 498, 523, 548
PUNJLLOYD CMP 67.85 SL 63.75 TGT 71.5, 80.3, 87.4, 94.9
EKC CMP 80.1 SL 75.5 TGT 87.6, 91.8, 96.8, 104
Please have comments on this..
|
|
| Back to top |
|
 |
casper
Green Belt

Joined: 02 Oct 2010
Posts: 1315
|
Post: #2370  Posted: Mon Apr 04, 2011 7:04 am Post subject: Posted: Mon Apr 04, 2011 7:04 am Post subject: |
 |
|
| ronypan wrote: | RANBAXY CMP 450.55 SL 444 TGT 489, 503
PIPAVAVYD CMP 80.65 SL 76 TGT 92.15, 97.05, 102
EDUCOMP CMP 431.1 SL 424 MX SL 421 TGT 464, 498, 523, 548
PUNJLLOYD CMP 67.85 SL 63.75 TGT 71.5, 80.3, 87.4, 94.9
EKC CMP 80.1 SL 75.5 TGT 87.6, 91.8, 96.8, 104
Please have comments on this.. |
for ranbaxy, target 470 max
reason 1)470 is strong resi and 2) the small at which broken out, gives us a target of 465-475 aprox
we have a symmetrical triangle in pipavav, if it broken out we can have 100 levels for sure, but the break should be solid one, with much volume
educomp i can not see any possible up move, at least i could not understand the pattern there 
same is punjlloyd
but ekc, was at which broken out and holding the bo level of 78, cmp 80, if it sustain above 82, it should go up to 86-89 level
| Description: |
|
| Filesize: |
30.64 KB |
| Viewed: |
267 Time(s) |

|
| Description: |
|
| Filesize: |
33.61 KB |
| Viewed: |
217 Time(s) |

|
| Description: |
|
| Filesize: |
27.49 KB |
| Viewed: |
235 Time(s) |

|
|
|
| Back to top |
|
 |
|
|
You cannot post new topics in this forum
You cannot reply to topics in this forum
You cannot edit your posts in this forum
You cannot delete your posts in this forum
You cannot vote in polls in this forum
You can attach files in this forum
You can download files in this forum
|
Powered by phpBB © 2001, 2005 phpBB Group
|
|
|

