| View previous topic :: View next topic |
| Author |
a layman's approach to break out and break down |
S.S.
White Belt

Joined: 09 Feb 2011
Posts: 241
|
Post: #2386  Posted: Tue Apr 05, 2011 1:05 am Post subject: Posted: Tue Apr 05, 2011 1:05 am Post subject: |
 |
|
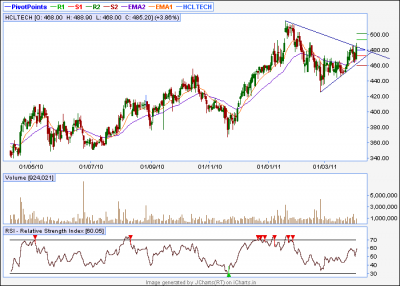
hcl-tech
493 weekly r1
512 could be the next level n abv 517 its shoot-up like a rocket.
casper bhai plz comment on it.....
| Description: |
|
| Filesize: |
14.37 KB |
| Viewed: |
249 Time(s) |
|
|
|
| Back to top |
|
 |
|
|
 |
casper
Green Belt

Joined: 02 Oct 2010
Posts: 1315
|
Post: #2387  Posted: Tue Apr 05, 2011 7:18 am Post subject: Posted: Tue Apr 05, 2011 7:18 am Post subject: |
 |
|
| S.S. wrote: | mundra port
abv 200/34 DMA
trendline break out
abv 148.5 trg arnd 151 / 161
less volume then prev day |
nice one s.s,
tell me one thing, why the prev days volume is greater? any idea??? 
rony, thanks and welcome,u have asked me something naa. soon i will reply u on that too 
|
|
| Back to top |
|
 |
casper
Green Belt

Joined: 02 Oct 2010
Posts: 1315
|
Post: #2388  Posted: Tue Apr 05, 2011 7:39 am Post subject: Posted: Tue Apr 05, 2011 7:39 am Post subject: |
 |
|
| S.S. wrote: | hcl-tech
493 weekly r1
512 could be the next level n abv 517 its shoot-up like a rocket.
casper bhai plz comment on it..... |
important to all
when we work with eod set up, plz dont pay any heed to weekly levels, suppose u have a set up in 5 min to 60 min chart and want to go by that "real time"set up, then only u should look for weekly levels
when u work on eod set up, u should follow monthly levels only, in case we have a eod set up and weekly level is some how very near to 34 ema, then only we should give importance to that level, otherwise weekly levels are not so strong , on their own, to provide support resistance on eod basis case
now back to hcltech
any strong close above 495 (trend line +some cushion) with good volume will give us , say , some 100 rupees move
as i always say.... dont become over optimistic, if we get this move,, it will be a gradual move not a "3 days and 100 covered" type of move
  
|
|
| Back to top |
|
 |
S.S.
White Belt

Joined: 09 Feb 2011
Posts: 241
|
Post: #2389  Posted: Tue Apr 05, 2011 9:11 am Post subject: Posted: Tue Apr 05, 2011 9:11 am Post subject: |
 |
|
| casper wrote: |
nice one s.s,
tell me one thing, why the prev days volume is greater? any idea??? 
|
i think bcoz its cross 34 EMA
Last edited by S.S. on Tue Apr 05, 2011 9:41 am; edited 1 time in total |
|
| Back to top |
|
 |
S.S.
White Belt

Joined: 09 Feb 2011
Posts: 241
|
Post: #2390  Posted: Tue Apr 05, 2011 9:15 am Post subject: Posted: Tue Apr 05, 2011 9:15 am Post subject: |
 |
|
| casper wrote: |
now back to hcltech
any strong close above 495 (trend line +some cushion) with good volume will give us , say , some 100 rupees move
as i always say.... dont become over optimistic, if we get this move,, it will be a gradual move not a "3 days and 100 covered" type of move
   |
but i thing we can see 6 to7 % rise in a day
490 is one resi. and 496 monthly r1
|
|
| Back to top |
|
 |
sumesh_sol
Brown Belt

Joined: 06 Jun 2010
Posts: 2344
|
Post: #2391  Posted: Tue Apr 05, 2011 1:44 pm Post subject: WELCORP Posted: Tue Apr 05, 2011 1:44 pm Post subject: WELCORP |
 |
|
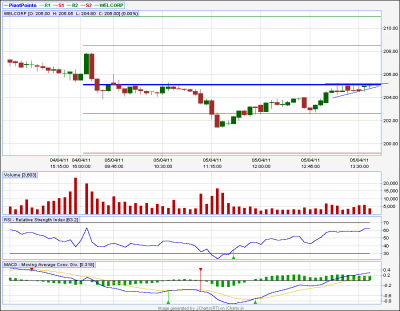
WELCORP
**********
A break above 205.4 can take it to day high +.
| Description: |
|
| Filesize: |
15.95 KB |
| Viewed: |
235 Time(s) |
|
|
|
| Back to top |
|
 |
casper
Green Belt

Joined: 02 Oct 2010
Posts: 1315
|
Post: #2392  Posted: Tue Apr 05, 2011 1:50 pm Post subject: Re: WELCORP Posted: Tue Apr 05, 2011 1:50 pm Post subject: Re: WELCORP |
 |
|
| sumesh_sol wrote: | WELCORP
**********
A break above 205.4 can take it to day high +. |
hii sumesh bhai, it cud be a good positional buy also, plz check , i think it should go up to 216-220 range, it is an eod set up
|
|
| Back to top |
|
 |
as4manju
White Belt

Joined: 22 Mar 2007
Posts: 390
|
|
| Back to top |
|
 |
sumesh_sol
Brown Belt

Joined: 06 Jun 2010
Posts: 2344
|
Post: #2394  Posted: Tue Apr 05, 2011 7:49 pm Post subject: MOSERBAER Posted: Tue Apr 05, 2011 7:49 pm Post subject: MOSERBAER |
 |
|
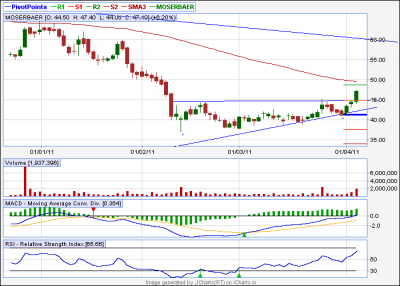
MOSERBAER ..EOD
********************
It has broken AT on EOD (LTP-47).. It has very high chance of touching 49.5/50 tomorrow.
If it trades above 50 for an hour or so, then positional can be taken for 55 . ( for 2-3 days)
| Description: |
|
| Filesize: |
21.88 KB |
| Viewed: |
249 Time(s) |
|
|
|
| Back to top |
|
 |
sumesh_sol
Brown Belt

Joined: 06 Jun 2010
Posts: 2344
|
Post: #2395  Posted: Tue Apr 05, 2011 7:59 pm Post subject: OMAXE Posted: Tue Apr 05, 2011 7:59 pm Post subject: OMAXE |
 |
|
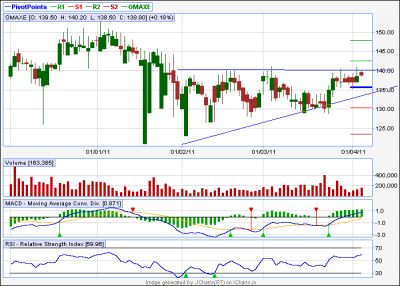
OMAXE ..eod
**************
A hourly close above 140 is must for it to reach 145/150..
| Description: |
|
| Filesize: |
23.48 KB |
| Viewed: |
218 Time(s) |
|
|
|
| Back to top |
|
 |
S.S.
White Belt

Joined: 09 Feb 2011
Posts: 241
|
Post: #2396  Posted: Tue Apr 05, 2011 8:28 pm Post subject: Posted: Tue Apr 05, 2011 8:28 pm Post subject: |
 |
|
| casper wrote: | | S.S. wrote: | mundra port
abv 200/34 DMA
trendline break out
abv 148.5 trg arnd 151 / 161
less volume then prev day |
nice one s.s,
tell me one thing, why the prev days volume is greater? any idea??? 
|
casper can u answer ur question y the volume was higher???
|
|
| Back to top |
|
 |
sumesh_sol
Brown Belt

Joined: 06 Jun 2010
Posts: 2344
|
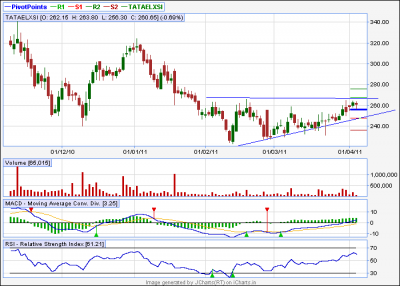
Post: #2397  Posted: Tue Apr 05, 2011 8:30 pm Post subject: TATAELXSI Posted: Tue Apr 05, 2011 8:30 pm Post subject: TATAELXSI |
 |
|
TATAELXSI ..EOD
********************
Above 270 (200 sma on eod) , it can reach 277 / 283
| Description: |
|
| Filesize: |
24.26 KB |
| Viewed: |
221 Time(s) |
|
|
|
| Back to top |
|
 |
S.S.
White Belt

Joined: 09 Feb 2011
Posts: 241
|
Post: #2398  Posted: Tue Apr 05, 2011 9:00 pm Post subject: Posted: Tue Apr 05, 2011 9:00 pm Post subject: |
 |
|
| as4manju wrote: | Hi SS,
i am posting a chart which is dated 25-03-2011 on which i had intiated a buy call and the current move up is indicated by the black line which i ve drawn.. with my little knowlodge and observation i ve seen the most difficult thing to break n sustain is a upward biased channel even if it breaks on the upside most of the times it ll be a false breakouts so i wouldnt buy sych break outs and another thing about channels is that smaller the better any channel height of 10-15% stocks tend to move side ways after false break outs so the possible upmove would be 3-4% max intra day but still its sucidel to buy.. i might be wrong but its just my view..
Regards
Manju
|
hi manju,
nice to see u after long time . . . . ur knowledge of reading charts(which u called little knowledge)  and ur experience in the market definitely helpful to me. keep commenting and keep teaching and keep sharing ur experience with us.now onward i will take care of what u and casper said. and ur experience in the market definitely helpful to me. keep commenting and keep teaching and keep sharing ur experience with us.now onward i will take care of what u and casper said.
thankx a lot ...
now a days casper bhaiya speaks very little. he also busy like u.
|
|
| Back to top |
|
 |
as4manju
White Belt

Joined: 22 Mar 2007
Posts: 390
|
Post: #2399  Posted: Tue Apr 05, 2011 9:30 pm Post subject: Posted: Tue Apr 05, 2011 9:30 pm Post subject: |
 |
|
Hi SS,
I dint knew ppl actually miss me here in the fourm i m just a peble in ocean i m not that expert either hahaha.. any will try my best to keep posting as when i get time...
Regards
Manju
| S.S. wrote: | | as4manju wrote: | Hi SS,
i am posting a chart which is dated 25-03-2011 on which i had intiated a buy call and the current move up is indicated by the black line which i ve drawn.. with my little knowlodge and observation i ve seen the most difficult thing to break n sustain is a upward biased channel even if it breaks on the upside most of the times it ll be a false breakouts so i wouldnt buy sych break outs and another thing about channels is that smaller the better any channel height of 10-15% stocks tend to move side ways after false break outs so the possible upmove would be 3-4% max intra day but still its sucidel to buy.. i might be wrong but its just my view..
Regards
Manju
|
hi manju,
nice to see u after long time . . . . ur knowledge of reading charts(which u called little knowledge)  and ur experience in the market definitely helpful to me. keep commenting and keep teaching and keep sharing ur experience with us.now onward i will take care of what u and casper said. and ur experience in the market definitely helpful to me. keep commenting and keep teaching and keep sharing ur experience with us.now onward i will take care of what u and casper said.
thankx a lot ...
now a days casper bhaiya speaks very little. he also busy like u. |
|
|
| Back to top |
|
 |
casper
Green Belt

Joined: 02 Oct 2010
Posts: 1315
|
Post: #2400  Posted: Tue Apr 05, 2011 9:34 pm Post subject: Posted: Tue Apr 05, 2011 9:34 pm Post subject: |
 |
|
| S.S. wrote: |
now a days casper bhaiya speaks very little. he also busy like u. |
both of us are busy like hell......
surprise.... 
|
|
| Back to top |
|
 |
|

