| View previous topic :: View next topic |
| Author |
a layman's approach to break out and break down |
chetan83
Brown Belt

Joined: 19 Feb 2010
Posts: 2036
|
Post: #2431  Posted: Fri Apr 08, 2011 11:18 am Post subject: CIPLA EOD Posted: Fri Apr 08, 2011 11:18 am Post subject: CIPLA EOD |
 |
|
Hi,
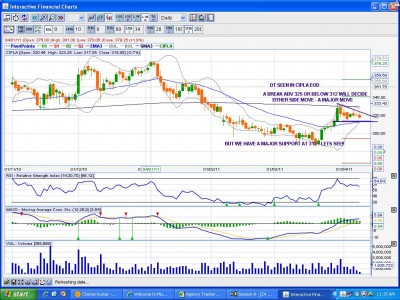
Do watch Cipla EOD, where DT is seen, but there is a strong Monthly support at 312. A break abv 324 can see some major move, whereas a break below 312-310 will see 15-20 points downmove.
Regards,
Chetan.
| Description: |
|
| Filesize: |
175.15 KB |
| Viewed: |
295 Time(s) |
|
|
|
| Back to top |
|
 |
|
|
 |
sumesh_sol
Brown Belt

Joined: 06 Jun 2010
Posts: 2344
|
Post: #2432  Posted: Fri Apr 08, 2011 11:46 am Post subject: NDTV Posted: Fri Apr 08, 2011 11:46 am Post subject: NDTV |
 |
|
NDTV..10tf
***************
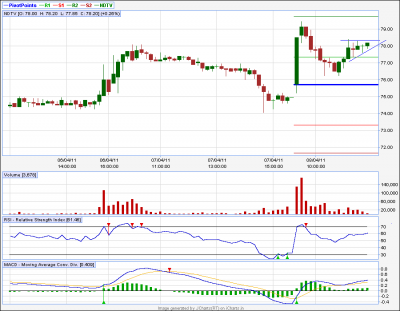
Above 78.5 it can see 79.7 /83
| Description: |
|
| Filesize: |
15.91 KB |
| Viewed: |
278 Time(s) |
|
|
|
| Back to top |
|
 |
sumesh_sol
Brown Belt

Joined: 06 Jun 2010
Posts: 2344
|
Post: #2433  Posted: Fri Apr 08, 2011 1:41 pm Post subject: MRPL Posted: Fri Apr 08, 2011 1:41 pm Post subject: MRPL |
 |
|
MRPL
**********
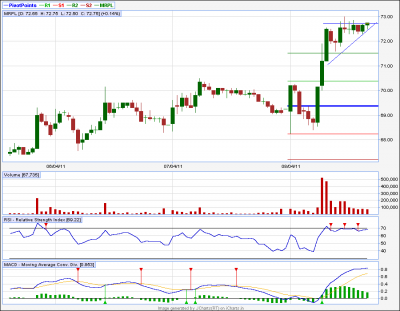
Above day high (73) .. It can blast..
| Description: |
|
| Filesize: |
14.81 KB |
| Viewed: |
253 Time(s) |
|
|
|
| Back to top |
|
 |
anand1234
Yellow Belt

Joined: 17 Jul 2010
Posts: 830
|
Post: #2434  Posted: Fri Apr 08, 2011 2:03 pm Post subject: Re: MRPL Posted: Fri Apr 08, 2011 2:03 pm Post subject: Re: MRPL |
 |
|
| sumesh_sol wrote: | MRPL
**********
Above day high (73) .. It can blast.. |
hi..........sumesh
any tgt??
thanks
anand
|
|
| Back to top |
|
 |
sumesh_sol
Brown Belt

Joined: 06 Jun 2010
Posts: 2344
|
Post: #2435  Posted: Fri Apr 08, 2011 2:04 pm Post subject: Re: MRPL Posted: Fri Apr 08, 2011 2:04 pm Post subject: Re: MRPL |
 |
|
| anand1234 wrote: | | sumesh_sol wrote: | MRPL
**********
Above day high (73) .. It can blast.. |
hi..........sumesh
any tgt??
thanks
anand |
For me 73.9/74.9 are the targets... SL 71.7
Also if u want buy PrajIND above high...
|
|
| Back to top |
|
 |
sumesh_sol
Brown Belt

Joined: 06 Jun 2010
Posts: 2344
|
Post: #2436  Posted: Fri Apr 08, 2011 2:05 pm Post subject: Re: MRPL Posted: Fri Apr 08, 2011 2:05 pm Post subject: Re: MRPL |
 |
|
| sumesh_sol wrote: | | anand1234 wrote: | | sumesh_sol wrote: | MRPL
**********
Above day high (73) .. It can blast.. |
hi..........sumesh
any tgt??
thanks
anand |
For me 73.9/74.9 are the targets... SL 71.7
Also if u want buy PrajIND above high... |
Sorry 72.2 SL..
|
|
| Back to top |
|
 |
anand1234
Yellow Belt

Joined: 17 Jul 2010
Posts: 830
|
Post: #2437  Posted: Fri Apr 08, 2011 2:37 pm Post subject: Re: RCF Posted: Fri Apr 08, 2011 2:37 pm Post subject: Re: RCF |
 |
|
| anand1234 wrote: | | sumesh_sol wrote: | | anand1234 wrote: | | sumesh_sol wrote: | | anand1234 wrote: | | sumesh_sol wrote: | RCF
********
Above 90 it can reach 95/105 |
hi........sumesh
I bought rcf @90.3...........and.........indiainfo 83.7..........now both r so down shd I hold for tgt ??..................pls guide me
thanks
anand |
Hi Anand,
I'm also long in both these, and I shall average at 34 ema of 60tf in both these..
However, I shall close my positions if any of them closes below 34 ema on 60tf.. Market taking rejection from long term trend line on eod.. But you never know  |
hi..............sumesh
below 34ema means ??.............pls tell me the figure............because I am not technical person
thanks
anand |
For Indiainfo it is roughly 78, and for RCF it is 84.5 |
hi.....sumesh
thanks for ur comments................if s/l will not hit..............can I take delivery??................
thanks
anand |
hi.........sumesh
indiainfo touched 78..............still hold for delivery is it ok??...pls guide me
thanks
anand
|
|
| Back to top |
|
 |
sumesh_sol
Brown Belt

Joined: 06 Jun 2010
Posts: 2344
|
Post: #2438  Posted: Fri Apr 08, 2011 2:39 pm Post subject: Posted: Fri Apr 08, 2011 2:39 pm Post subject: |
 |
|
Anand Please exit Indiainfo.. I have also booked loss...
Market is getting heavily beaten...
Let it regain some sense, then we will enter in some good scrip..
|
|
| Back to top |
|
 |
anand1234
Yellow Belt

Joined: 17 Jul 2010
Posts: 830
|
Post: #2439  Posted: Fri Apr 08, 2011 2:59 pm Post subject: Posted: Fri Apr 08, 2011 2:59 pm Post subject: |
 |
|
| sumesh_sol wrote: | Anand Please exit Indiainfo.. I have also booked loss...
Market is getting heavily beaten...
Let it regain some sense, then we will enter in some good scrip.. |
hi.......sumesh
thanks for ur comments
thanks
anand
|
|
| Back to top |
|
 |
ridinghood
Yellow Belt

Joined: 16 Apr 2009
Posts: 724
|
Post: #2440  Posted: Fri Apr 08, 2011 3:21 pm Post subject: Posted: Fri Apr 08, 2011 3:21 pm Post subject: |
 |
|
Dear casper/sumesh
after around 2 years nifty 200sma currently at 5713 is on the verge of crossing 100 sma currently at 5714. let us say if this happens that is 200sma>100sma will it have any significance towards long term trnd change (say from bullishness to bearishness).
pl confirm any of the experts.
regs
ridinghood
|
|
| Back to top |
|
 |
casper
Green Belt

Joined: 02 Oct 2010
Posts: 1315
|
Post: #2441  Posted: Fri Apr 08, 2011 4:26 pm Post subject: Posted: Fri Apr 08, 2011 4:26 pm Post subject: |
 |
|
hi rajeev!
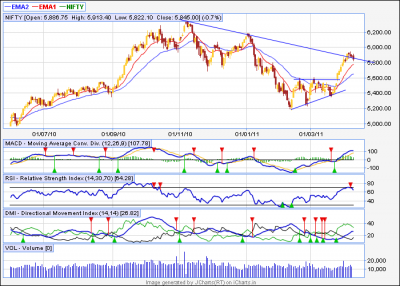
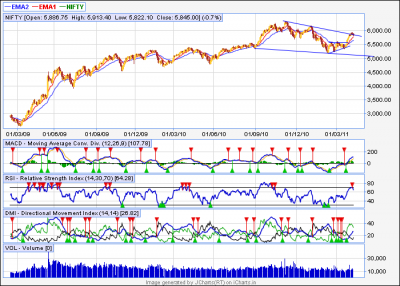
brother, i will show u another view of nifty, comprising only trend lines 
i have two pictures, one is close view and another is zoomed out view of nifty
we have a down trend line, by connecting the highs nifty made from diwali and this line is resiting any upmoves so far
to have a sustainable bull run, we need to close over this line strongly and to have a down move, we need to go down this line, that too, strongly
now, we had a few close above that line in past a few days but all the candles were too weak to suggest any thing
today we have broken down it (provisionally) now if after "after market adjustment" we really stay below this level, then we may have a tough time ahead..... what is more annoying, if we stay below this line for a couple of days then we can go down some 100 points in a day too, simply bcoz the trailing stops of bulls will start hitting
if we really go down then the 200sma/34ema will provide us interim relief, but at the same time, down trend will be confirmed and we will make another low below 200sma, i think that low will be a lower low, some where around 5000 range
now u see the zoomed out picture, u will notice that the support is around that 5000 level only
  
ps
whenever any bigger moving average goes above and lesser moving average goes below the bigger one, it suggest that market is going down, bocz the average of greater number days can be higher than avergage of lesser/recent days only when the candles are going down in recent time.
is not it???
its true for any ma combination, right from 5ema/12ema combo to 200/500sma  
| Description: |
|
| Filesize: |
35.83 KB |
| Viewed: |
319 Time(s) |
|
| Description: |
|
| Filesize: |
41.79 KB |
| Viewed: |
309 Time(s) |
|
|
|
| Back to top |
|
 |
singh.ravee
Yellow Belt

Joined: 12 Aug 2010
Posts: 678
|
Post: #2442  Posted: Fri Apr 08, 2011 6:10 pm Post subject: Posted: Fri Apr 08, 2011 6:10 pm Post subject: |
 |
|
Casper Bhai Hello,
From 5850 to 5000; isn't it a very big range. I doubt such kind of down move.
According to me 5600 is going to be a very good support area. Probably entry on the long side on retracement is going to be a good strategy.
Most unpredictable part about future is future itself. Let's see.
Thanks and Regards
Ravee
|
|
| Back to top |
|
 |
singh.ravee
Yellow Belt

Joined: 12 Aug 2010
Posts: 678
|
Post: #2443  Posted: Fri Apr 08, 2011 6:13 pm Post subject: Posted: Fri Apr 08, 2011 6:13 pm Post subject: |
 |
|
P.S. to previous post:
As a trader we should not be much worried about going up or down. We should rather concenterate on the move and try to get maximum out of it.
Thanks and Happy trading to u all
ravee
|
|
| Back to top |
|
 |
casper
Green Belt

Joined: 02 Oct 2010
Posts: 1315
|
Post: #2444  Posted: Fri Apr 08, 2011 6:43 pm Post subject: Posted: Fri Apr 08, 2011 6:43 pm Post subject: |
 |
|
paaji
i think u hv not read it very carefully, or may be this is my inability to describe the things, as i hv weekend ahead, so i hv a lil time for forum today, lets go ahead 
1. i did mention that 34 ema and 200sma is going to give u some relief
if u see the chart u will see that 34 ema is around 5600 and 200sma is around 5700 , so does it match to ur target???
2.i did mentioned that it will be interim relief, why? hv u ever thought why this crazy casper is writing that even 200 sma will be a temporary support?
u might hv thought , might hv not, but since i hv started this, so its my duty to clarify things, so among lots of reasons which i cud quote, i am giving a simple reason for understanding of all
from diwali to today, we are making LOWER HIGHS and unless we break the mentioned trend line, we CAN NOT MAKE ANY HIGHER HIGH. RIGHT?

if we acknowledge this move is finishing here (at least for discussion bcoz unless we break the tl , we will not make any higher high, so this is a "top")
so we will have 3 lower tops and two lower bottoms in between.........what does it indicate paaji??
clearly down trend, is not it???
so in that clearly established downtrend, with out breaking that important trend line, how can we say we will get back from 5700-5800-5600 or wherever??
ur numbers CAN give a support, i am saying strongly, IT CAN GIVE SUPPORT, but tell me one thing
without breaking that tl which is now a resistance, do u see any up move is possible?????????
and all my previous analysis was assuming that we do not break out that trend line only.......
now plz give me a feed back, am i clear now?
  
in response to ur ps i wll say u r right, as a short term trader we are immune to such things.... but hv u see what rajeev aka ridinghood asked?? he is asking about long term trend only
u and me are not concerned for the longer term trend, but he is concerned, and thats why i am writing all thees things

|
|
| Back to top |
|
 |
ridinghood
Yellow Belt

Joined: 16 Apr 2009
Posts: 724
|
Post: #2445  Posted: Fri Apr 08, 2011 7:31 pm Post subject: Posted: Fri Apr 08, 2011 7:31 pm Post subject: |
 |
|
Dear CASPER
thnx alot brother for beautifully explaining the nifty movements. this will help alot people like me in taking positions in nifty. 
regs
ridinghood
ps
i have also become fan of paaji nd manju sir for catching the phenomenal upmove from 5348.
|
|
| Back to top |
|
 |
|

