|
|
| View previous topic :: View next topic |
| Author |
a layman's approach to break out and break down |
S.S.
White Belt

Joined: 09 Feb 2011
Posts: 241
|
Post: #2521  Posted: Thu May 05, 2011 12:45 am Post subject: Posted: Thu May 05, 2011 12:45 am Post subject: |
 |
|
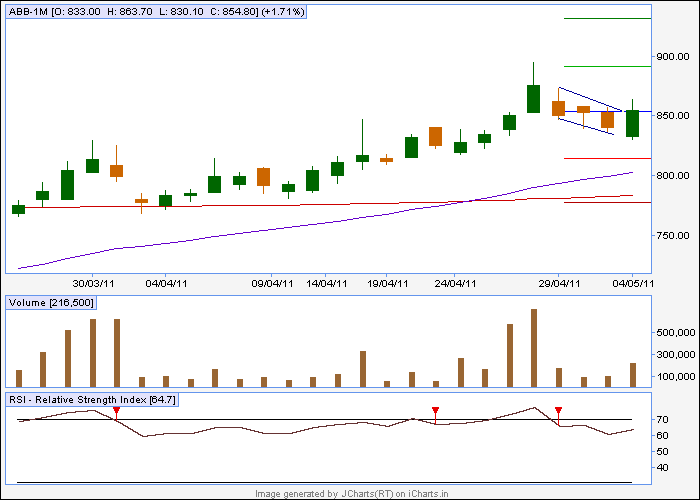
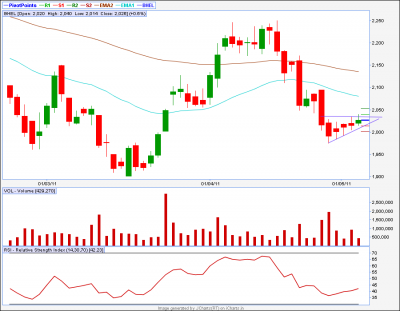
two stock to b watch
abb (future)- abv858
bhel abv 2034
| Description: |
|
| Filesize: |
6.37 KB |
| Viewed: |
1425 Time(s) |
|
| Description: |
|
| Filesize: |
26.47 KB |
| Viewed: |
303 Time(s) |
|
|
|
| Back to top |
|
 |
|
|  |
casper
Green Belt

Joined: 02 Oct 2010
Posts: 1315
|
Post: #2522  Posted: Thu May 05, 2011 8:23 am Post subject: Posted: Thu May 05, 2011 8:23 am Post subject: |
 |
|
hi s.s.
yes nowadays going a bit busy with our new born website 
though i check forum every day, but since no questions was asked to me, i did not post anything also 
lets jump to the charts
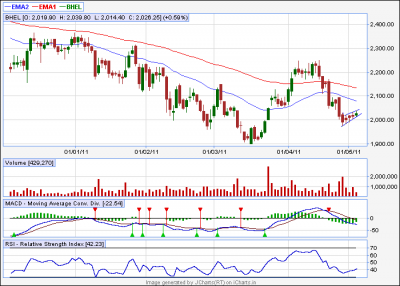
1.bhel eod
it looks like an AT but plz notice that corresponding macd is bearish, so, though we can buy on bo still, as a caution , i want to present another picture also,eod bhel with some diff drawings, (jc21), in this case, we can sell below the lower tl also
2.ongc
its a nice c/h formation, i must congratulate you for this,302 was bo level, and see, after a tremendous fall in market, how well it ferried above bo level!
above 302, or even better, above 307 (302+5 rs cushion) it should reach 340 in short term, u can safely target 325-330 at least
3.abb
i could not understand the pattern here, but i guessed that u take it for a flag, if u think it is flag then avoid it, coz here flag pole is too small, and u may remember that in case of flag, flag pole is the potential target, here this short falg pole gives u very small target, which, i fear, is taken out already by the bo candle
| Description: |
|
| Filesize: |
13.14 KB |
| Viewed: |
338 Time(s) |
|
|
|
| Back to top |
|
 |
S.S.
White Belt

Joined: 09 Feb 2011
Posts: 241
|
Post: #2523  Posted: Thu May 05, 2011 9:07 am Post subject: Posted: Thu May 05, 2011 9:07 am Post subject: |
 |
|
| thakx casper all the best for the new project i m eager to know abt the site....
|
|
| Back to top |
|
 |
anand1234
Yellow Belt

Joined: 17 Jul 2010
Posts: 830
|
Post: #2524  Posted: Thu May 05, 2011 9:10 am Post subject: Posted: Thu May 05, 2011 9:10 am Post subject: |
 |
|
hi...............casper
pls share ur views abt aban in mid to long term...............wt will b the tgt??
thanks
anand
|
|
| Back to top |
|
 |
casper
Green Belt

Joined: 02 Oct 2010
Posts: 1315
|
Post: #2525  Posted: Thu May 05, 2011 9:50 am Post subject: Posted: Thu May 05, 2011 9:50 am Post subject: |
 |
|
hii anand bhai
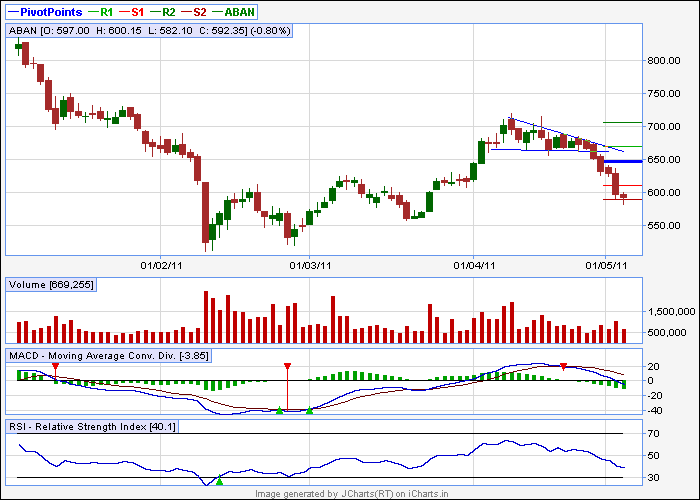
plz check the pictures of aban eod
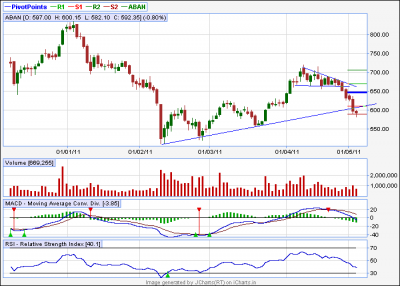
in chart number 22, it shows the reason of fall, it was a descending triangle and it broken down nicely, with the help of bearish sentiment in the market, it reached targets also
now as per eod of yesterday, it stopped at monthly s2and as of now, its pulling up with the market
now see chart number 23
for a fresh buying, aban should cross the rising trend line and close above monthly r1 at 609 also
so if today aban closes above 609 then u can buy it for a short to mid term target of 650 atleast
| Description: |
|
| Filesize: |
10.54 KB |
| Viewed: |
1431 Time(s) |
|
| Description: |
|
| Filesize: |
11.88 KB |
| Viewed: |
320 Time(s) |
|
|
|
| Back to top |
|
 |
jjm
White Belt

Joined: 17 Mar 2010
Posts: 411
|
|
| Back to top |
|
 |
casper
Green Belt

Joined: 02 Oct 2010
Posts: 1315
|
Post: #2527  Posted: Thu May 05, 2011 7:25 pm Post subject: Re: DLF_eod Posted: Thu May 05, 2011 7:25 pm Post subject: Re: DLF_eod |
 |
|
| jjm wrote: | Dear Casper/Singhji,
Hi!
It has been long time I have not contributed ( rather bothered you ) 
Is Neckline drawn is correct ?
Do the correction if it is not same, requested to post your views
For validation of this pattern we need to have back testing of neckline..If it is so then price shld retrace till neckline or till horizontal line drawn
If price does not retrace and touches neckline then how to do the trade
Is my believe is right that to validate pattern price has to retrace back and touch neckline and takes rejection
Regards
JJM |
hi jjm
welcome back and ya its long time that u posted again  and as far as bothering's concern, i wish, you bother us more often!!! and as far as bothering's concern, i wish, you bother us more often!!!
now the chart,
1.i have made small correction on your drawing, it may not matter in this case, but some time in future u may need to draw it perfectly
2.a little "gyaan" 
categorically, we can have 3 kinds of h/s,
i) neutral one------- its bearish just like any other h/s
ii) slopped down----- more bearish than neutral
iii)slopped up------- less bearish among the lot
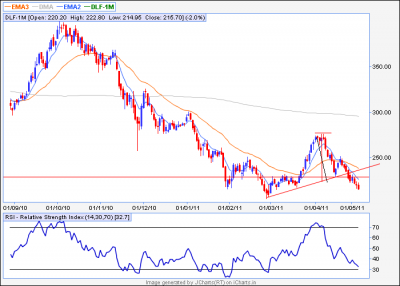
in this case, dlf is slopped up h/s where if we get around 60-75% of total target projection then we will be more than happy
3.normally, h/s, inv h/s cases have a tendency to make a "back thrust" (the term is back thrust, not back test,if u say back test, ppls will get confused as we back test strategies, so plz never use that term)
but its not a rule, so we can not depend on that too much, but its also true that some expert prefers to sell/buy on back thrust as they regard it as a safer approach, but every thing comes at a price, so u may loss chance of trading if u always wait for back thrust
4. so best entry point is , sell it when h/s break below the neckline or buy it when inv h/s break above the neckline and cover ur position on extreme then if u get retracement and rejection to neckline then well and good
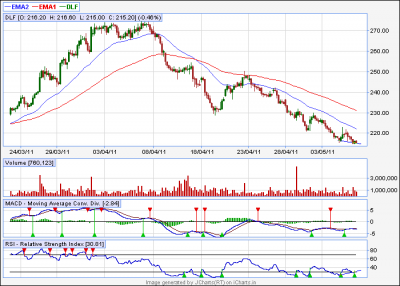
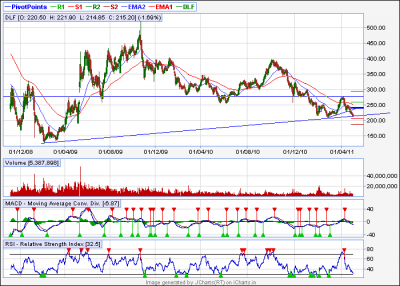
5. as per my drawing in eod dlf chart, i see dlf is sitting on a long term tl (chart no-24)
and in 60 min chart it has some +div also (chart no 25)
going by these data, we can expect some choppy move around the cmp and may be (thin hope, as we should not bet on +div in bear phase and- div in bull phase, unless we get EOD div,a simple thumb rule, so choppy move is what i can expect here)
6. so let us open fresh sell below 215, preferably , below recent intra low or get ready to sell it on rise if it retarces
7.if it retraces, then predicting how much it wud retrace is tough job, it can be upto that long term tl mentioned by you or can be upto neckline also
but as per my exp, i can say that i hv seen , more older tl, more stronger support, so the long term tl u mentioned, is going to be a tough nut to crack for sure, so in any retracement, i will try to open short on your mentioned tl and will use any close above tl as my sl
| Description: |
|
| Filesize: |
32.13 KB |
| Viewed: |
314 Time(s) |
|
| Description: |
|
| Filesize: |
15.59 KB |
| Viewed: |
306 Time(s) |
|
| Description: |
|
| Filesize: |
20.26 KB |
| Viewed: |
327 Time(s) |
|
|
|
| Back to top |
|
 |
casper
Green Belt

Joined: 02 Oct 2010
Posts: 1315
|
Post: #2528  Posted: Thu May 05, 2011 7:46 pm Post subject: Posted: Thu May 05, 2011 7:46 pm Post subject: |
 |
|
hi s.s.
sorry for dragging ur reply here, but i feel it is going to be an important post which may be useful for others as well
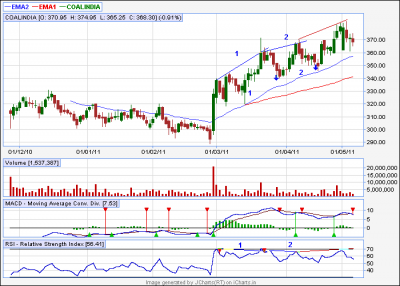
lets see coal india, check my posted chart and match with my commentary, plz pay attention (i know, u will  ) coz its going to be tricky ) coz its going to be tricky
we have two div here , one set is marked with 1 and another set is marked with 2
1st div
price making higher high, rsi making lower high, we we have a -div here and price is coming down to 34 ema, to find support around it, the result of this fall is marked with a down arrow
2nd div
then again price is going higher but rsi going lower, thus making the 2nd set of div, which results in a fall, marked by another down arrow (set 2)
red trend line marked area
this time price is making higher high and rsi is also making higher high
so this not a divergence any more
so our conclusion is, coalindia had div of course but that already "worked up" present move is not a case of divergence in eod

| Description: |
|
| Filesize: |
13.68 KB |
| Viewed: |
352 Time(s) |
|
|
|
| Back to top |
|
 |
S.S.
White Belt

Joined: 09 Feb 2011
Posts: 241
|
|
| Back to top |
|
 |
singh.ravee
Yellow Belt

Joined: 12 Aug 2010
Posts: 678
|
Post: #2530  Posted: Thu May 05, 2011 9:39 pm Post subject: Posted: Thu May 05, 2011 9:39 pm Post subject: |
 |
|
| S.S. wrote: | great work dada
bang   once again hatssss offffff to u . . . . i thing i have to buy hats in dozen once again hatssss offffff to u . . . . i thing i have to buy hats in dozen
ok i want to ask u when there is divergence how to calculate targer n 2nd thing abt coal i m posting the chart where i had dawn a div line n rectangle. can we say that the rect part was the result of -div? |
With kind permission of casper bhai,
S.S.
Regarding ur query on rectangle area, let casper handle it. My views may differ and may add some confusion.
for me coal india is in good uptrend. utilise dips to add to ur positions. The target here seems to be 420+.
Regards.
ravee
P.S: I am optimistic on this counter since ipo days.
|
|
| Back to top |
|
 |
jjm
White Belt

Joined: 17 Mar 2010
Posts: 411
|
Post: #2531  Posted: Thu May 05, 2011 10:30 pm Post subject: Posted: Thu May 05, 2011 10:30 pm Post subject: |
 |
|
Dear Casperda,
noted your comments with great care..
Thanks a ton
Regards,
JJM 
|
|
| Back to top |
|
 |
S.S.
White Belt

Joined: 09 Feb 2011
Posts: 241
|
Post: #2532  Posted: Fri May 06, 2011 12:03 am Post subject: Posted: Fri May 06, 2011 12:03 am Post subject: |
 |
|
| singh.ravee wrote: |
With kind permission of casper bhai,
S.S.
Regarding ur query on rectangle area, let casper handle it. My views may differ and may add some confusion.
for me coal india is in good uptrend. utilise dips to add to ur positions. The target here seems to be 420+.
Regards.
ravee
P.S: I am optimistic on this counter since ipo days. |
raveebhai i m agree with u even i m optimistic abt this counter n i thng this is realy going to be maharatna in PSU. n my belife(no TA - no FA) the FPO shoudl be arnd 800
|
|
| Back to top |
|
 |
casper
Green Belt

Joined: 02 Oct 2010
Posts: 1315
|
Post: #2533  Posted: Fri May 06, 2011 8:14 am Post subject: Posted: Fri May 06, 2011 8:14 am Post subject: |
 |
|
| S.S. wrote: | great work dada
bang   once again hatssss offffff to u . . . . i thing i have to buy hats in dozen once again hatssss offffff to u . . . . i thing i have to buy hats in dozen
ok i want to ask u when there is divergence how to calculate targer n 2nd thing abt coal i m posting the chart where i had dawn a div line n rectangle. can we say that the rect part was the result of -div? |
1.my way of calculating target for any case is very simple, i always use weekly pivot and associated level OR monthly pivots and associated level and 34/89 ema in real time and only 34 ema + weekly +monthly level for eod chart
at times important trend lines comes in to action and fib level too (if nothing is near by, then draw and use fib  ) )
2.i dont know which among the lot is more imp and which is less imp, but ofcourse monthly levels are stronger than weekly levels,eod trend lines are stronger than real time trend line, but u know i just dont bother 
3.i have told myself on numerous occasion during trading that "tushar, u r a daily trader, so plz dont try to kill an"elephant" and get killed in this process,plz kill a "rabbit" every day but kill it constantly"
i have seen so many guys saying proudly that " this week i hv lost on 7 occasion but made a huge come back on 8th trade and this 8th trade made me so much money which covered all my loss and even bring me weekly profit also"
i would humbly say, my psychology does not permits this kinds of trading, i would rather make small profit in every trade and will hold for a big target only if every thing is suitable for me. and that happens once in a blue moon!
so basically, my targets are always small
going by this psychology, i normally book my position if any of the aforesaid levels come near by, so all are equally important for me
4.the rectangular zone in your chart is the result of divergence. divergence is so beautiful way of trading, (if u can apply it nicely), that you can compare this trading style with a "sniper gun", it wont give us huge move like a tank in the war (break out system  ) but will surely help you to take out important targets ) but will surely help you to take out important targets
before we go into "in-depth discussion" plz answer me a simple question
why price reverse?
plz reply my query as and when possible, then we can see how things works in the market
p.s though this question is primarily for you, but if any of the visitors wants to join the discussion then they can also reply the question
  
|
|
| Back to top |
|
 |
anand1234
Yellow Belt

Joined: 17 Jul 2010
Posts: 830
|
Post: #2534  Posted: Fri May 06, 2011 9:44 am Post subject: Posted: Fri May 06, 2011 9:44 am Post subject: |
 |
|
| casper wrote: | hii anand bhai
plz check the pictures of aban eod
in chart number 22, it shows the reason of fall, it was a descending triangle and it broken down nicely, with the help of bearish sentiment in the market, it reached targets also
now as per eod of yesterday, it stopped at monthly s2and as of now, its pulling up with the market
now see chart number 23
for a fresh buying, aban should cross the rising trend line and close above monthly r1 at 609 also
so if today aban closes above 609 then u can buy it for a short to mid term target of 650 atleast |
hi..........casper
now aban is trading above 609...........can I buy for tgt 640 in short term??
pls guide me
thanks
anand
|
|
| Back to top |
|
 |
casper
Green Belt

Joined: 02 Oct 2010
Posts: 1315
|
Post: #2535  Posted: Fri May 06, 2011 9:56 am Post subject: Posted: Fri May 06, 2011 9:56 am Post subject: |
 |
|
sorry for late reply,
yes u can
by da way,,if u r a real time chart subscriber, then i have a simple rule for u
whenever you buy/sell see the volume, if volume is rising in your direction and important level is also breaking, then go ahead
|
|
| Back to top |
|
 |
|
|
You cannot post new topics in this forum
You cannot reply to topics in this forum
You cannot edit your posts in this forum
You cannot delete your posts in this forum
You cannot vote in polls in this forum
You can attach files in this forum
You can download files in this forum
|
Powered by phpBB © 2001, 2005 phpBB Group
|
|
|

