|
|
| View previous topic :: View next topic |
| Author |
a layman's approach to break out and break down |
sumesh_sol
Brown Belt

Joined: 06 Jun 2010
Posts: 2344
|
Post: #2536  Posted: Fri May 06, 2011 10:33 am Post subject: HCLTECH Posted: Fri May 06, 2011 10:33 am Post subject: HCLTECH |
 |
|
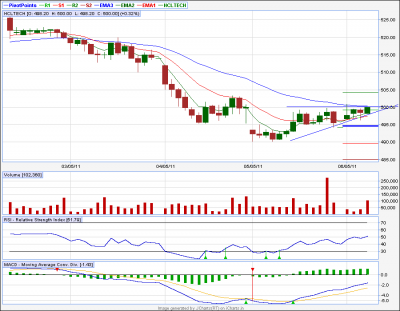
HCLTECH ..30tf
**********
Above 501 , I expect it to reach 505/510.
| Description: |
|
| Filesize: |
16.46 KB |
| Viewed: |
293 Time(s) |
|
|
|
| Back to top |
|
 |
|
|  |
anand1234
Yellow Belt

Joined: 17 Jul 2010
Posts: 830
|
Post: #2537  Posted: Fri May 06, 2011 10:48 am Post subject: Posted: Fri May 06, 2011 10:48 am Post subject: |
 |
|
HI..........CASPER/SUMESH
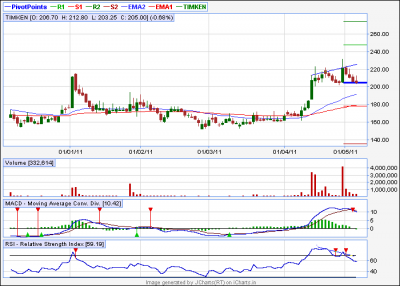
can u tell me abt timken...........now 208............. I bought @212..........pls tell me wt will b the tgt sor short term??.any s/l is req??
thanks
anand
|
|
| Back to top |
|
 |
casper
Green Belt

Joined: 02 Oct 2010
Posts: 1315
|
Post: #2538  Posted: Fri May 06, 2011 2:15 pm Post subject: Posted: Fri May 06, 2011 2:15 pm Post subject: |
 |
|
timken
today if it breaks below 204 and closes below that then leave it
otherwise u will get back ur price and may be a few rupees more
if it holds 204 and goes up today (it has no real time chart so cant say what's happening) then u can target 225-230 in short term
ps. forgot to add the chart here, see price made high, rsi made low, a clear -div, thats why it came down from 210+ levels, now if 204 holds then we can discount the div issue for now and go high afresh
| Description: |
|
| Filesize: |
11.87 KB |
| Viewed: |
313 Time(s) |
|
|
|
| Back to top |
|
 |
anand1234
Yellow Belt

Joined: 17 Jul 2010
Posts: 830
|
Post: #2539  Posted: Fri May 06, 2011 3:07 pm Post subject: Posted: Fri May 06, 2011 3:07 pm Post subject: |
 |
|
| casper wrote: | timken
today if it breaks below 204 and closes below that then leave it
otherwise u will get back ur price and may be a few rupees more
if it holds 204 and goes up today (it has no real time chart so cant say what's happening) then u can target 225-230 in short term
ps. forgot to add the chart here, see price made high, rsi made low, a clear -div, thats why it came down from 210+ levels, now if 204 holds then we can discount the div issue for now and go high afresh |
hi....casper
thanks a lot for ur comments..................now a days u r not posting ur analisys.................if poss pls keep posting...............it is helping us to trading..............
thanks
anand
|
|
| Back to top |
|
 |
casper
Green Belt

Joined: 02 Oct 2010
Posts: 1315
|
Post: #2540  Posted: Fri May 06, 2011 8:09 pm Post subject: Posted: Fri May 06, 2011 8:09 pm Post subject: |
 |
|
hi anaand dada
though i was busy wid our website and had a few other smaller issues  but i do acknowledge that staying away from forum was a foolish decision from my side but i do acknowledge that staying away from forum was a foolish decision from my side
i am emotional guy out of my trading room (certainly not in my trading room  ) )
and its true that i am emotionally attached with all of u, so from now on, i will try my best to be available in forum everyday
|
|
| Back to top |
|
 |
S.S.
White Belt

Joined: 09 Feb 2011
Posts: 241
|
Post: #2541  Posted: Fri May 06, 2011 10:10 pm Post subject: Posted: Fri May 06, 2011 10:10 pm Post subject: |
 |
|
dada u had asked a question i will try to answer it
why price reverse?
price movement mainly depends on supply and demand buyer want to buy and seller don’t want to sell so the stock is in short supply - prices increase. buyers will pay more for it and when the stock is abundance the price fall. seller want to sell at any rate and buyer try to get it cheaper. so price reveres
now I like to add further whats makes buyer to buy the stock? there are plenty. inflation, interest rates, gov policies, political situation, growth stories, taxes, comp. managements, co’s future projection and many more …….
when some of the factors are positive rather say favorable people keep buying the stock and when it turns negative they starts selling n price reveres.
thats it dada.....
|
|
| Back to top |
|
 |
casper
Green Belt

Joined: 02 Oct 2010
Posts: 1315
|
Post: #2542  Posted: Fri May 06, 2011 10:21 pm Post subject: Posted: Fri May 06, 2011 10:21 pm Post subject: |
 |
|
| S.S. wrote: | dada u had asked a question i will try to answer it
why price reverse?
price movement mainly depends on supply and demand buyer want to buy and seller don’t want to sell so the stock is in short supply - prices increase. buyers will pay more for it and when the stock is abundance the price fall. seller want to sell at any rate and buyer try to get it cheaper. so price reveres
now I like to add further whats makes buyer to buy the stock? there are plenty. inflation, interest rates, gov policies, political situation, growth stories, taxes, comp. managements, co’s future projection and many more …….
when some of the factors are positive rather say favorable people keep buying the stock and when it turns negative they starts selling n price reveres.
thats it dada..... |
right soumik, this is the "fundamental" or "reason" part, and well explained by u too
but all these factors, works lately
just seeing a chart can u tell me when the price will reverse? just think about it
when we see charts, we generally discount every thing else, just thik about some "chartists terms"
where a price upmove should stop? i know u already know it, just take it easy and think
where a price should stop?
(sorry for creating suspense)
  
|
|
| Back to top |
|
 |
jjm
White Belt

Joined: 17 Mar 2010
Posts: 411
|
Post: #2543  Posted: Sat May 07, 2011 6:44 pm Post subject: Posted: Sat May 07, 2011 6:44 pm Post subject: |
 |
|
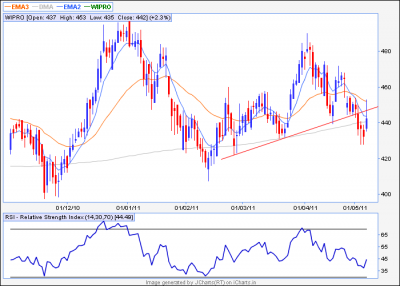
Dear Casperda/ Singhji,
In case of wipro backthrust already done?? last daily candle touched NL..
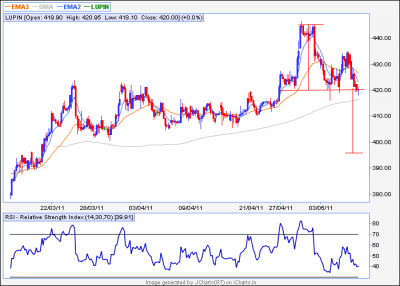
Lupin i think a good bet it is very close to Nl hence SL can be really small I will prefer to put 425 CC basis 60 tf
Regards,
JJM
| Description: |
|
| Filesize: |
24.14 KB |
| Viewed: |
333 Time(s) |
|
| Description: |
|
| Filesize: |
26.12 KB |
| Viewed: |
342 Time(s) |
|
|
|
| Back to top |
|
 |
casper
Green Belt

Joined: 02 Oct 2010
Posts: 1315
|
Post: #2544  Posted: Sun May 08, 2011 11:16 am Post subject: Posted: Sun May 08, 2011 11:16 am Post subject: |
 |
|
hi jjm
1.lupin
we can not call it a h/s becoz left shoulder is at 425 and right shoulder is at 435, to qualify as a true h/s we need symmetry between both the shoulders,(mind u, symmetry, means visual symmetry, not equal hight)
however it has broken an important support and next support is at 413, below which it should go down upto 409,404 levels, so its a good bet downward ofcourse
2.wipro i think it was a slopped (less bearish) h/s which broken down and made its back thrust also
and now it should head down, 430 is going to be a tough support level, below which 410 is possible
(by da way, have u noticed that during back thrust, it went up beyond neck line and faced 34ema in eod? this was the best shorting chance, say 50%-25% short cud be made around this level with strict sl of 34ema + some cushion and more short could be initiated below neckline)
|
|
| Back to top |
|
 |
jjm
White Belt

Joined: 17 Mar 2010
Posts: 411
|
Post: #2545  Posted: Mon May 09, 2011 3:45 pm Post subject: Posted: Mon May 09, 2011 3:45 pm Post subject: |
 |
|
Dear Casperda,
Lupin: noted comments...
Wipro : I did notice that back thrust to 34 ema ..will keep those things in mind while tracking stocks.. Pt of entry suggested was really appropriate with best R: R

JJM
|
|
| Back to top |
|
 |
jjm
White Belt

Joined: 17 Mar 2010
Posts: 411
|
Post: #2546  Posted: Mon May 09, 2011 4:07 pm Post subject: Posted: Mon May 09, 2011 4:07 pm Post subject: |
 |
|
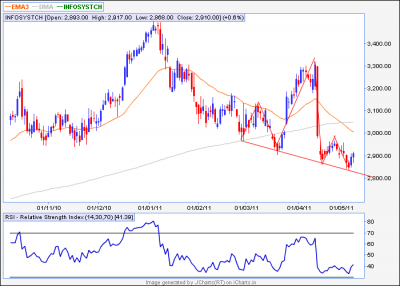
Casperda Hi
For your kind perusals
Regards,
JJM
| Description: |
|
| Filesize: |
23.82 KB |
| Viewed: |
358 Time(s) |
|
|
|
| Back to top |
|
 |
singh.ravee
Yellow Belt

Joined: 12 Aug 2010
Posts: 678
|
Post: #2547  Posted: Mon May 09, 2011 5:01 pm Post subject: Posted: Mon May 09, 2011 5:01 pm Post subject: |
 |
|
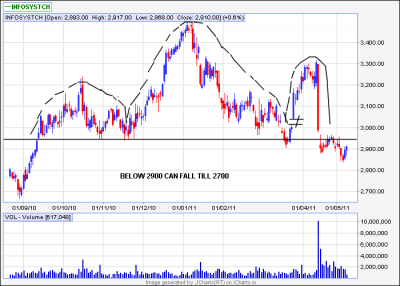
jjm
kindly have a look at this. i m viewing infy in this way. current move seems more of a throwbacks to this long term trendline as resistance
casper bhai, the height of right shoulder is a bit concern, thats why i am not treating it as hns
rgds
ravee
| Description: |
|
| Filesize: |
18.13 KB |
| Viewed: |
319 Time(s) |
|
|
|
| Back to top |
|
 |
casper
Green Belt

Joined: 02 Oct 2010
Posts: 1315
|
Post: #2548  Posted: Mon May 09, 2011 10:17 pm Post subject: Posted: Mon May 09, 2011 10:17 pm Post subject: |
 |
|
hii jjm and paaji
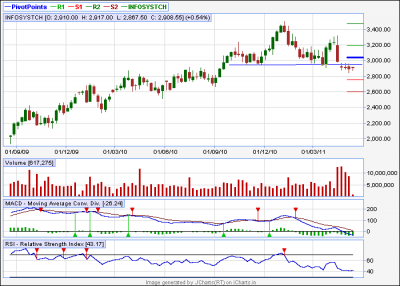
here is the weekly chart of infy
i think both the chart u posted, are valid, though right shoulder is abnormally high, still it has the essence of h/s (as head part is very prominent, and the volume is also following the classic route- classic volume for a h/s is- left shoulder higher vol, head vol is a lil lower than left shoulder and right shoulder should have the least vol, its following the same)
again the chart jjm posted, which is a slopped down h/s(more bearish)
so in order to avoid confusion, i have switched to the weekly chart 
its also a h/s (specially if u take the upper shadow of left shoulder than symmetry is also there)and being higher tf, it will give us robust signal, and here we can see the break down from neckline had taken place with a gap, thanks to mr.mohandas pai 
a gap fill up move is expected, and if it does then paaji's long term tl will be the last hurdle for bull and last ray of hope for bear, downside 2600 aprx is destination  
as far as jjm's chart, (short to mid term view) yes, below 2825,2775 to 2750 is target on short to mid term (target given depending on my favorite monthly pivots)
and finally my intra to btst view
2900 is monthly pivot, if it stays below it short it with a target of 2850-2825
| Description: |
|
| Filesize: |
12.29 KB |
| Viewed: |
340 Time(s) |
|
|
|
| Back to top |
|
 |
S.S.
White Belt

Joined: 09 Feb 2011
Posts: 241
|
|
| Back to top |
|
 |
S.S.
White Belt

Joined: 09 Feb 2011
Posts: 241
|
Post: #2550  Posted: Tue May 10, 2011 12:41 am Post subject: Posted: Tue May 10, 2011 12:41 am Post subject: |
 |
|
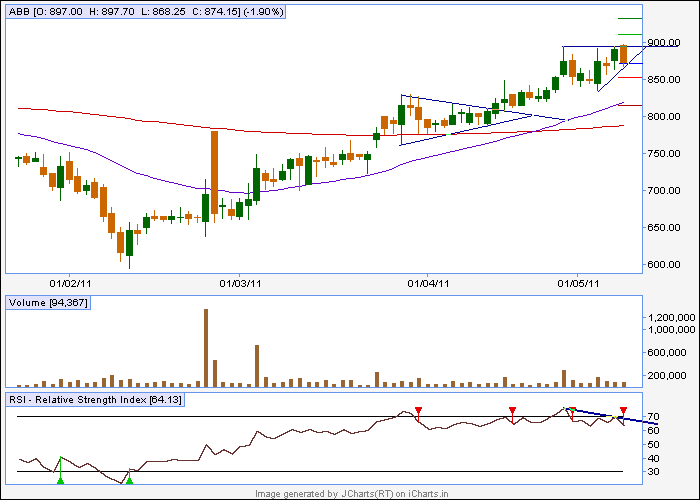
what do u say abt abb???
| Description: |
|
| Filesize: |
8.41 KB |
| Viewed: |
1570 Time(s) |
|
|
|
| Back to top |
|
 |
|
|
You cannot post new topics in this forum
You cannot reply to topics in this forum
You cannot edit your posts in this forum
You cannot delete your posts in this forum
You cannot vote in polls in this forum
You can attach files in this forum
You can download files in this forum
|
Powered by phpBB © 2001, 2005 phpBB Group
|
|
|

